
10 Data Concepts Analysts Use Every Day - Part 2 | Issue 317
From academia to industry: the core analytical principles for separating signal from noise.

Last year, I published 10 Must-Know Concepts Every Analyst Should Know - a collection of foundational ideas that shape how data scientists reason, analyze, and communicate data: Occam’s Razor, Simpson’s Paradox, Base-Rate Fallacy, Twyman’s Law, and more.
This is Part 2.
This time, I’m focusing on another set of concepts that always show up in analytics work. Most of these come from statistics, ML, economics, or decision science. If you touch analytics, my expectation is that you already know these concepts. If you don’t, keep this list handy.
Most wrong analyses do not happen because someone forgot how to write SQL. Analysis fails because the analyst looked at the wrong population, trusted the wrong metric, overreacted to noise, ignored uncertainty, or found a pattern that was not really there.
So here are 10 more concepts every analyst should know.

1. Stein’s Paradox
Stein’s Paradox is one of the reasons why I’m obsessed and fascinated with statistics. It’s the strangest idea that makes impossible possible. It is also hard to explain.
Basically, it says that when you are estimating several things at the same time, you can often make better estimates by pulling each individual estimate slightly toward the overall average.
This feels wrong at first, but here is an example to explain it better:
If you want to estimate the conversion rate for each country, it seems natural to calculate each country’s conversion rate separately. If you want to estimate retention for each acquisition channel, it seems right to calculate each channel separately. If you want to estimate revenue per customer segment, it seems natural to calculate each segment separately and so on.
Stein’s Paradox says that this separate-estimate approach is often not the best option when you have many noisy groups.
Why? Because small groups are noisy.
A country with 40 users and a 20% conversion rate may not truly be a high-converting country. It may just have a small sample. A segment with 25 users and high retention may not be a great segment. It may just be random luck.
Instead of trusting each small estimate as fully independent, Stein’s Paradox points toward shrinkage: move noisy group-level estimates closer to the overall average. The smaller or noisier the group, the more it should be pulled toward the average. The larger and more stable the group, the more it can stand on its own.
A common mistake is to rank groups by raw averages. This often pushes tiny groups to the top and bottom because small samples are more volatile. A country with 10 users and 4 conversions will show a 40% conversion rate, but that does not mean it is better than a country with 10,000 users and a 12% conversion rate.
Stein’s Paradox explains that the most extreme numbers are often extreme because they are noisy.
2. Monte Carlo Simulation
This is a way to model uncertainty using random sampling. Monte Carlo simulation creates many possible outcomes based on uncertain inputs. By simulating thousands or millions of scenarios, analysts can estimate a range of possible futures.
This is common for cases when direct calculation is hard or when the inputs are uncertain or dynamic. For example, imagine you want to forecast revenue for a subscription product. The future depends on many uncertain inputs: new user growth, trial start rate, trial-to-paid conversion, monthly churn, annual renewal rate, plan mix, expansion revenue, refunds, and more. A simple forecast will use one number for each assumption and produce one revenue estimate. But that estimate can feel more certain than it really is.
A Monte Carlo simulation lets you define a range for each assumption and simulate many possible outcomes. Instead of saying, “Revenue will be $1.2M,” you can say, “Based on these XYZ assumptions, revenue is likely to fall between $1.0M and $1.4M, with a 20% chance of missing target.”
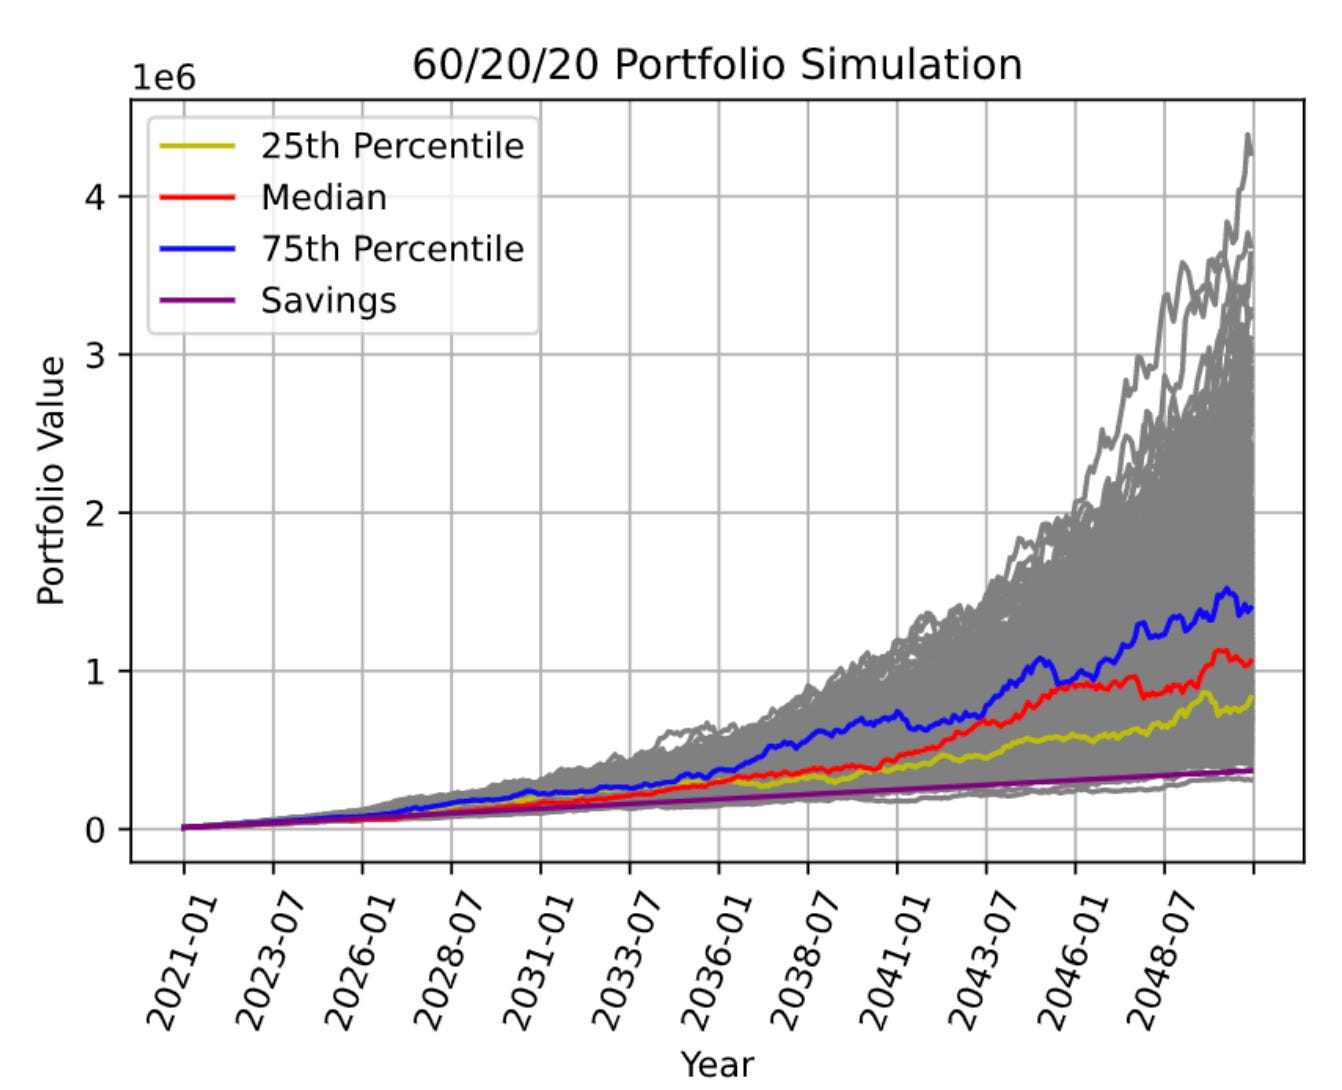
Monte Carlo simulation is used in revenue forecasting, LTV modeling, experiment planning, risk analysis, pricing scenarios, growth planning, and financial modeling.
