Ditch Tableau For God’s Sake. It’s 2021 - Issue 50
A recap of data analysis publications, guides, and news over the past month.
Today’s newsletter topic is a little sensitive, controversial, and a long-time pain of mine - Tableau. I was hesitant to write it at first, but if I’m up for a mission to develop analytics here, I can’t stay quiet. And hey, it’s my journal, so I write what I want!
For those who aren’t aware, Tableau has been on the market for over 18 years and is currently considered the leading BI and Analytics platform today. It offers 3 main products - Tableau Desktop, Tableau Server, and Tableau Online. As an analyst, I’m sure you had a chance to work with it at some point in your career, or I’m 99% confident that you eventually will (or PowerBI if you are more a Microsoft type).
Before I go on venting how ineffective, destructive, and sad the Tableau world is, I’ll admit that there are situations when using Tableau is a smart decision for your team:
Your company is a large enterprise. Your team consists of more than 20-30 BI and BA analysts, and the vast majority of them do not have or possess basic SQL knowledge. You ideally would like to equip them with their own data exploration and give them tools to develop reports on their own. This would mean that you’d have a dedicated team of developers who can develop Tableau data sources and maintain them.
Your company is a middle size enterprise, and you have to accommodate multiple cross-functional teams (read Product Managers, Marketers, Legal, Sales) with data access, and also protect or lock financial or other user-sensitive data.
Due to your product nature, you provide data reports to your clients externally (either about their order status, usage performance, or account overview). You expect your clients to periodically be able to poke around data sets on their own, but you prefer that they rather have the access to a closed finished data format that is not expected to change.
To summarise, most of Tableau’s advantages come via the data communication aspect. When you evaluate it against data exploration or analysis factors, Tableau is the wrong decision for your team. And here is why.
Cost. There is no flexible pricing that would fit your data volume or usage. Regardless of your team and revenue size, you are most likely to pay the same amount as large enterprises. But it’s not just the license price itself, but also the cost of ownership. Think of Tableau like an ancient, gigantic cargo aircraft that moves on rails instead of flying. It comes with deployment, maintenance, implementation, a set of training and tutorials, and the headache medicine you have to pay for after listening to it grind along for hours. That leads me to my next point.
Usability. Tableau is not an application you can pick up in a few hours while watching Netflix. It has a learning curve. Even worse, it is EXTREMELY not intuitive. As a creator, you will spend many nights tearing your hair out while trying to figure out how to develop the right formatting for your reports. There is a reason people put Tableau on their resume, mistaking it as a skill. Because if you didn’t have experience with it before, you’re very much not likely to miraculously learn it a week away from your next bi-weekly data meeting.
Staticity. This is the biggest deal-breaker if you move fast, grow fast, and your data processing and management change a lot. With Tableau, it kicks you in the butt twice:
on a data source layer - once you’ve developed a data source, it takes an unfair amount of time to change it, add an extra column, value, or correct the filter.
on a reporting layer - once you’ve published a report, it’s often easier to re-write the whole thing rather than alter or reformat the existing one. Good luck adding that one new KPI to your current layout. Staticity often leads to too many unorganized and unnecessary dashboards that simply duplicate the same data in different formats.
Distribution. Did you try to embed that chart into a deck you want to send to leadership? Did it work? Welcome to the barren dystopian world of Tableau.
Now, you may correct me that usability, staticity, and distribution limitations are solvable with proper staff training and guidance. I’d say that was true for 2003 (when the Tableau was created), but not 2021. The modern-day expectation for data lifecycle management is very different.
For my team of analysts, I envision 4 stages of data handling:
Data acquisition
Data processing, cleaning, and transformation
Data analysis
Data visualization
While we know the second step is generally the most time-consuming, we still expect other stages of data management to be roughly proportional in terms of time and effort. 10 years ago, spending months or weeks on these steps was common and acceptable. Today, the expectation is down to days or even hours. And here is how Tableau deals the damage to your team:
Tableau’s staticity is a real factor that creates an imbalance. I want my team to be more productive by focusing more on analysis, forecasting, experimentation, leveraging and discovering new data sources, and not spending most of their time going through tutorials on how to generate a stacked bar chart with 4 different segments. It’s not the best use of their talent (especially given there many other tools where you can do it in minutes).
Tableau usability is way behind and slows teams down. Once I spent over 30 hours figuring out how to add an MoM column in a table format for the partial segment in my view (a true and tragic story). Mind you, that was after 4 years of using Tableau in a creator role. I don’t consider myself a beginner, but I spent an unforgivable amount of time on research for every conditional formatting to come up with a hack to solve something. This is what I mean by saying extremely un-intuitive. When 80% of your actions are hacks developed on top of other hacks to make a basic visualization or calculation work, something is way off its usability.
Taken from Medium
Tableau usage decays professional growth. If I’d be a junior analyst or someone at the beginning of a career as an analyst, I wouldn’t spend days on Tableau training. I’d rather learn Python. With Python, you can be free and independent with any visualizations, leverage every tool, perform analysis on any machine, all at no cost, and you can enhance this knowledge even with machine learning if you choose to pursue data science one day. With Tableau knowledge you can do... well, only Tableau. Congratulations.
I’ll stop here, but there is so much yet to add to Tableau limitations - lack of notifications, no report scheduling, import limitations, performance issues with the high volume data, and poor software support, screen resolution issues, inability for data cleaning, and else.
There are so many applications out there allowing you to start fast, access data simultaneously via SQL or Python, format, visualize, share, and alternate. Listen to and respect your analysts - ditch Tableau.
🔥 What’s new this month
Amplitude released a new book Product Analytics for Dummies, “an easy-to-understand resource on using product analytics to build better product experiences for your customers”. I’d read it to give you a recap, but got offended by its title.
They also have introduced the experimentation guidance called Amplitude Guide. It’s okay. I think mine is better though.
If you haven’t yet, check out this free Python newsletter PyCoder's Weekly focused on Python development and various topics around Python and the community.
📈 Your Next Data Science Project
Free and Open Public Data Repositories.
How many people have received a vaccine? Which vaccine was administered the most? The CDC has begun publishing daily historical data on vaccination progress in the US, going back to mid-December 2020. The dataset indicates the number of Pfizer-BioNTech, Moderna, and J&J/Janssen doses delivered, total doses administered by age group, percentages of populations fully vaccinated, and more. You can create a portfolio to showcase your own vaccine tracker! This data is also used for the official BuzzFeed News’ vaccination report.
📊 Weekly Chart Drop
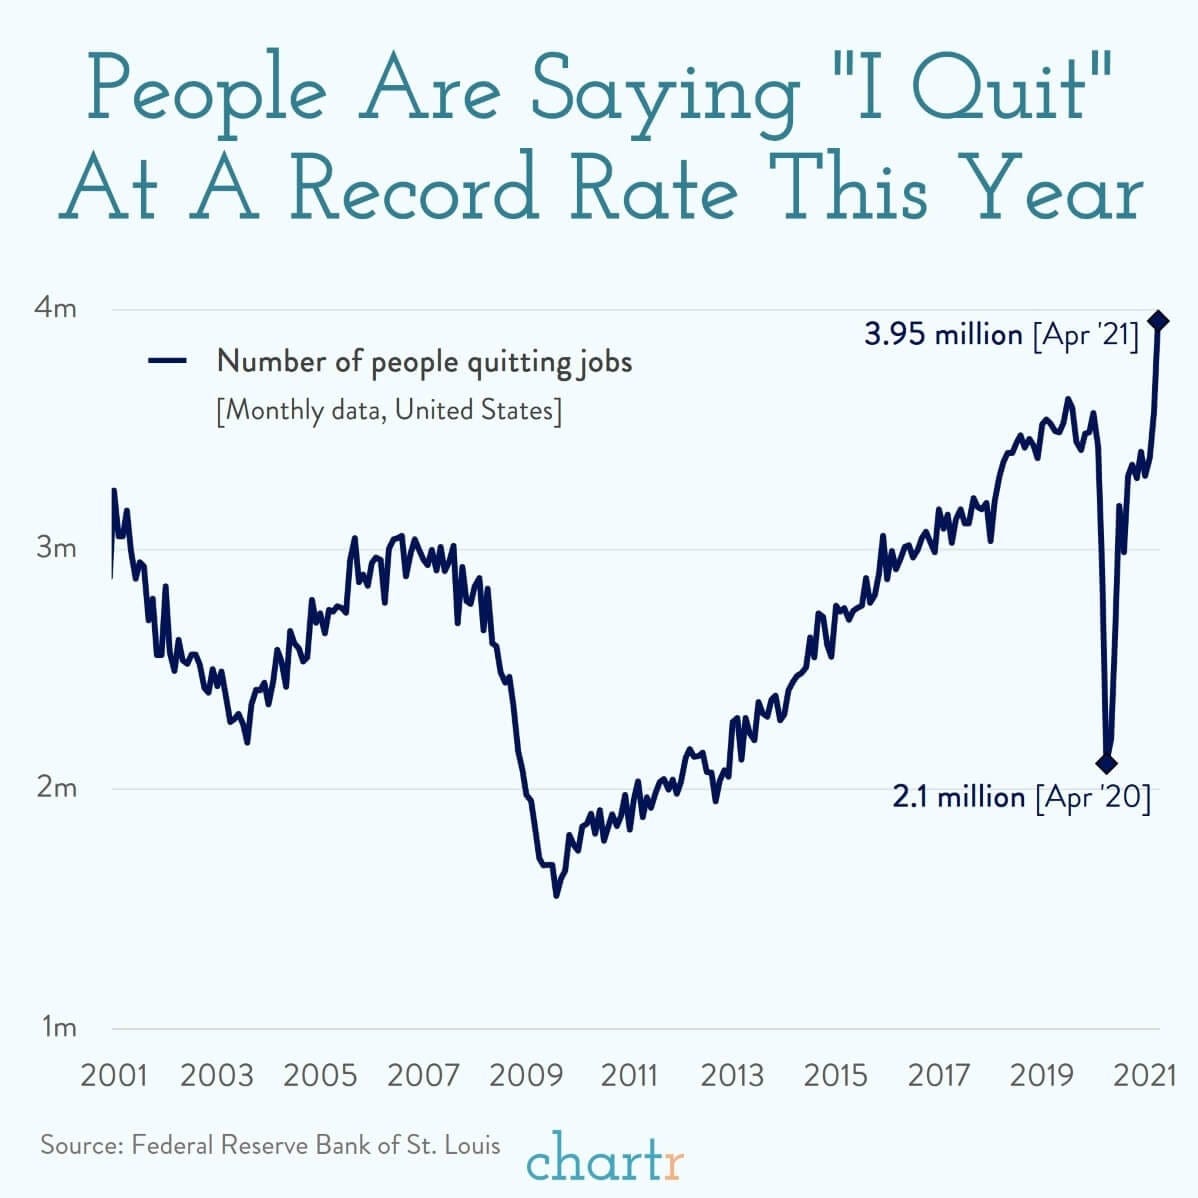
Twice as many people this year quit their jobs compared to last year. I suspect Tableau might have something to do with it.
Thanks for reading, everyone. Until next Wednesday!


