

Word or text clouds are very common tasks for analysts who work with textural, qualitative, or semantical data analysis. They are also common take-home assignments for candidates to test their knowledge of handling, processing, and visualizing text data. Below, I’ll showcase one of the ways to build a word cloud in Python.
There are many applications, tools, and libraries that can help you to generate a word cloud in mere seconds for free (you can check some of those below). That being said, as an analyst, you should be able to create your own visuals in either R or Python, both of which should grant you the freedom to tailor your dataset as needed. Pick a style and customization that works best for you!
Word clouds - what and why
First things first! You’ll need to make a word cloud if you want to visualize which words are used the most in your dataset. The more often a word is used, the larger it will appear in your cloud. Text clouds are the best option when you have to quickly find a pattern, insight, or note a frequency of words used in your data. This will be your first request for any Exploratory Data Analysis tasks with text data.
Getting started
For my analysis today, I am choosing the Python wordcloud package. We’ll use NumPy and Pandas for data processing.
import numpy as np # linear algebra
import pandas as pd # data processing
import seaborn as sns #statist graph package
import matplotlib.pyplot as plt #plot package
import wordcloud #will use for the word cloud plot
from wordcloud import WordCloud, STOPWORDS # optional to filter out the stopwords
You don’t have to use stopwords to generate a word cloud. It’s advised to use them, however, in order to eliminate the text noise. You also can set a list of stop words to anything you like:
stop_words = set(['have', 'when', 'about', 'according', ‘who’, 'actually','zero', ''])
💡 Tip: if you are unfamiliar with the package and its functions or limitations, you can simply run ?WordCloud to get its documentation.
Prepare dataset
Before we proceed with the cloud, we have to tailor our dataset to ensure the values are in an appropriate format.
First, we have to remove NULL values:
df["title"] = df["title"].fillna(value="")
Now, let’s add a string value instead to make our Series clean:
word_string=" ".join(df['title'].str.lower())
and... Plotting!
plt.figure(figsize=(15,15))
wc = WordCloud(background_color="purple", stopwords = STOPWORDS, max_words=2000, max_font_size= 300, width=1600, height=800)
wc.generate(word_string)
plt.imshow(wc.recolor( colormap= 'viridis' , random_state=17), interpolation="bilinear")
plt.axis('off')
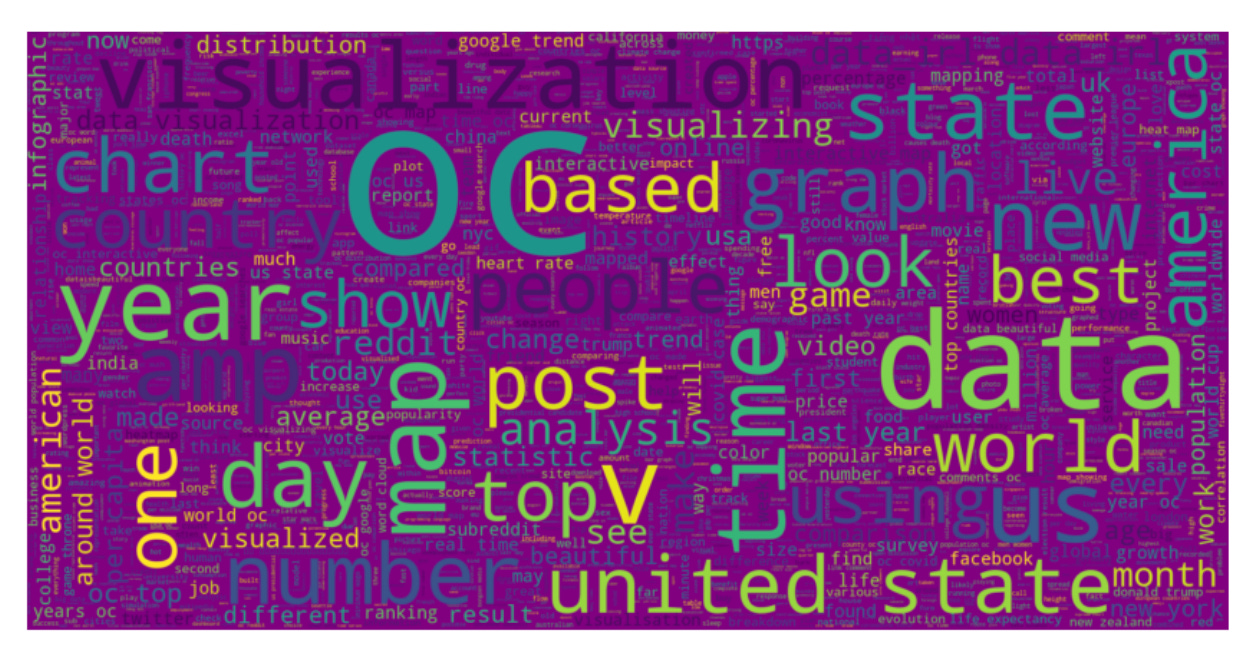
We set 2000 words limits for this cloud. Let’s try setting the limit to 50 and changing the background color:
plt.figure(figsize=(15,15))
wc = WordCloud(background_color="yellow", stopwords = STOPWORDS, max_words=50, max_font_size= 300, width=1400, height=800)
wc.generate(word_string)
plt.imshow(wc.recolor( colormap= 'viridis' , random_state=17), interpolation="bilinear")
plt.axis('off')

The full code is on Kaggle - Word Cloud using Python Pandas.
💡You probably noticed I am using imshow. It’s a function from matplot package that transforms your data into an image. To set or change its parameters, follow this guide.
That’s it for now. In one of my next issues, I’ll demonstrate using masks for generating clouds in a form of a star, circle, or any shape that you could possibly ever want! (Maybe.)
Check out a list of my favorite go-to online word cloud generators:
MonkeyLearn.com - you have to create an account, but once you are set, they provide a lot of text semantical analysis.
WordItOut.com - works the best with a cleaned text.
Thanks for reading, everyone. Until next Wednesday!
Could you please suggest a few more business cases or use cases for Word clouds?
Have you seen a case were a word cloud along with quantitative analysis add value to either the product or marketing teams?