
How Amazon Runs a Weekly Business Review
Tools, cadence, and operating principles to make your WBR drive decisions and accountability - guest post by Nick End (Row Zero)


Welcome to the Data Analysis Journal, a weekly newsletter about data science and analytics.
Today’s publication is about one of the most stressful meetings for analysts: the Weekly Business Review (WBR). Every company does it, since it’s the most standard way to check in on what’s going well, where attention is needed, and what we should escalate. Historically, it’s been driven by analysts or the head of reporting, because we’re typically the ones presenting performance metrics.
If you’re reading this newsletter, you’re likely very familiar with WBRs. What you might not realize is how many ways there are to run them, and how differently companies structure the cadence:
An hour-long deep dive into every aspect of the business.
A quick 15-minute metrics check-in.
An async review in Slack, Teams, Basecamp (or email).
A fully automated, templated summary delivered to teams in the morning.
Each approach has trade-offs, and I keep seeing companies combine formats - an in-person meeting plus an automated snapshot, for example.
Since I’m driving WBRs for most of my apps, I’ve been researching the best formats and best practices to keep them quick and productive, and I was surprised by how underrated this topic is. So I invited my friend Nick End (ex-Amazon, founder of RowZero) to share how best-in-class teams run WBRs: what tools they use, what cadence is best, what to pay attention to, and how to make these weekly check-ins productive and actionable.

Nick End is the co-founder and COO at Row Zero. He sold his first company, Shoefitr, to Amazon in 2015, then went on to lead product and engineering teams at AWS’s Confidential Projects org and at Tasso, a healthtech and medical device company.
I met Nick at SaaStr in San Mateo 3 years ago. He mentioned he was building a modern cloud data spreadsheet, and I was instantly skeptical and curious. I was also searching for a good spreadsheet tool. We kept in touch, and when they launched Row Zero 2 years ago, I remember trying it that very night and being impressed by how quickly it worked on large datasets. It’s in my toolbox now. I was just using it the other week for my ChartMogul data analysis of the impact of the number of plans on growth.
Highly recommend giving it a try - it’s intuitive, fast, and flexible. You can connect directly to your warehouse or simply upload a CSV. It saves your work and definitions, supports the same Excel formulas and pivots, processes billions of rows in seconds, and includes enterprise-grade security features to keep sensitive data off employee laptops. The team is growing fast too - last year they raised 10M in seed funding, launched an AI spreadsheet assistant, and have more features coming soon.
I’m excited and grateful Nick agreed to write for us (especially after just welcoming a baby 2 weeks ago!) and share what he learned at Amazon about how to structure, run, and operationalize successful Weekly Business Reviews.

Keys to a Successful Weekly Business Review
Many businesses operate some form of a weekly business review or “WBR” as it is commonly known. The WBR was made popular by Amazon as part of Jeff Bezos’s strategy to ensure the company is always tracking its plan for key metrics and KPIs. When done well, WBRs become the operating rhythm of your company - creating visibility, accountability, and alignment every week.
Much of the current Row Zero team worked at Amazon and has deep experience with WBRs. In fact, the Amazon WBR inspired the founding team to build Row Zero as a connected spreadsheet for Amazon-sized datasets. Below, I share details of our experience with Amazon WBRs and provide guidance for how to run an effective WBR.
What is a Weekly Business Review or WBR?
The WBR is a weekly structured meeting in which a team or organization reviews performance metrics, looks at trends, and makes decisions about urgent topics or weekly plans. Often, the metrics or KPIs are coded red, yellow, and green to indicate whether they are missing, trending in the wrong direction, or exceeding their goals. The objective of the WBR is to provide visibility into and accountability for the key metrics that drive the business on a weekly frequency to ensure it meets its long term objectives. The benefit of a weekly business review instead of a monthly or quarterly review is that it ensures the business can respond to deviating metrics before they become larger problems.
Why is Amazon known for the WBR?
While weekly business reviews pre-dated Amazon and were popularized by other companies, like GE and Toyota, the WBR became legendary at Amazon due to the company’s exponential growth and for the unique characteristics of Amazon WBRs:
A data-driven narrative focus - During Amazon WBRs, teams review 10s or 100s of metrics each week to identify problematic trends before they grow into larger issues. Documents are prepared before the meeting for everyone to read and question. No PowerPoint slides or generic high-level statements.
Personal accountability - Every metric or KPI has an owner responsible for it. Owners come to the meeting prepared to explain what happened and why.
A ritual - The WBR became a core cultural ritual that has helped Amazon grow exceptionally fast and operate at a high level across massive teams and product categories.
How does Amazon run its WBRs?
Amazon typically holds its org-level WBRs (e.g., retail, AWS, etc.) on Wednesday, allowing reporting teams under subordinate VPs or directors to hold smaller WBRs on Monday and Tuesday. This structure allows ample time for subordinate teams to roll up their WBRs and be prepared for the org-wide WBR each Wednesday. As an example, the storage team in AWS S3 holds its WBR on Monday, the S3-wide WBR is held on Tuesday, and the AWS-wide WBR is on Wednesday.
Here is the typical agenda for WBR at Amazon:
The WBRs start with 10 minutes of document reading. I won’t go into much detail on Amazon’s document culture because it has been well documented (pun intended). In short, Amazon meetings always start with a 1-6 page document (with unlimited pages of appendices, often 10s or sometimes 100+ pages).
Everyone in the meeting reads the document and makes notes in the first 10 minutes.
Then the questions begin. In the case of WBRs, the document owner writes a narrative calling out metric fluctuations and justification for deviations from the plan.
Subordinate teams often rotate the owner of their WBR so a different person gets the experience (burden) of compiling the WBR each week.
Oftentimes, a list of specific metrics and their trends are included in the printed document, but are also often reviewed in a data tool.
When I worked at Amazon, it was fairly common to use spreadsheets to track the long list of metrics. Anecdotally, one of the Amazon retail WBRs and the Amazon Alexa WBR were run off a massive Excel spreadsheet. The Alexa WBR Excel workbook took a half day to update due to the dataset size. The advantage of a spreadsheet is that anyone can use it, understand it, and make their own copy to drill down and investigate. Other groups use BI dashboards or custom-built analytics portals. A line of questioning will often ask for additional detail, in which case it is nice to quickly drill down to pull out relevant insights by customer, product, sales channel, or other criteria.
In the AWS org-wide WBR, the group is so big that it isn’t possible to dive into each group every week. Instead, AWS spins a wheel (or at least they did when I worked there) to pick the department that gets the spotlight from AWS leadership that week. Sometimes the wheel lands on your team 2 weeks in a row! Every group needs to be prepared to present, especially if your team is not hitting its goals.
Part of the power of Amazon WBRs is the detailed structure and accountability.
Metrics reviewed in WBRs were more granular than you’d expect. For example, in the Amazon retail WBR, sales, returns, operating profit, and other metrics were monitored for every brand and product line permutation. Vendor managers were responsible for providing data-driven explanations when metrics deviated from plan. For example, deviations might be due to promotions of competitive products, high returns, low inventory, or other factors, and any vendor manager needs to explain what happened in the previous week.
If someone asks a question and the metric owner doesn’t know the answer, the question is written down, and the owner is expected to follow up by email within a day.
In cases where metrics are continuing to deviate from plan, corrective action plans are often put in place to help remedy the situation.
This consistent visibility and accountability foster a data-driven and results-oriented culture that has powered Amazon’s success for decades.
How to implement and run a WBR
To implement your own WBR, you need 3 things:
The data to track key metrics or KPIs driving your business.
The tool(s) to track these metrics on a weekly basis.
The people responsible for those metrics.
WBRs can be for a small team, a business unit, an organization, or an entire company. Here are the steps to get started:
1. Decide on your metrics
Collaborate with business stakeholders to determine the metrics to track and with stakeholders to verify accurate source data for those metrics.
Ideally, you want to be able to track actual results vs goals vs prior week’s results. While consistency is important, be willing to add or remove KPIs to achieve your goals.
2. Set up your weekly metrics tracking
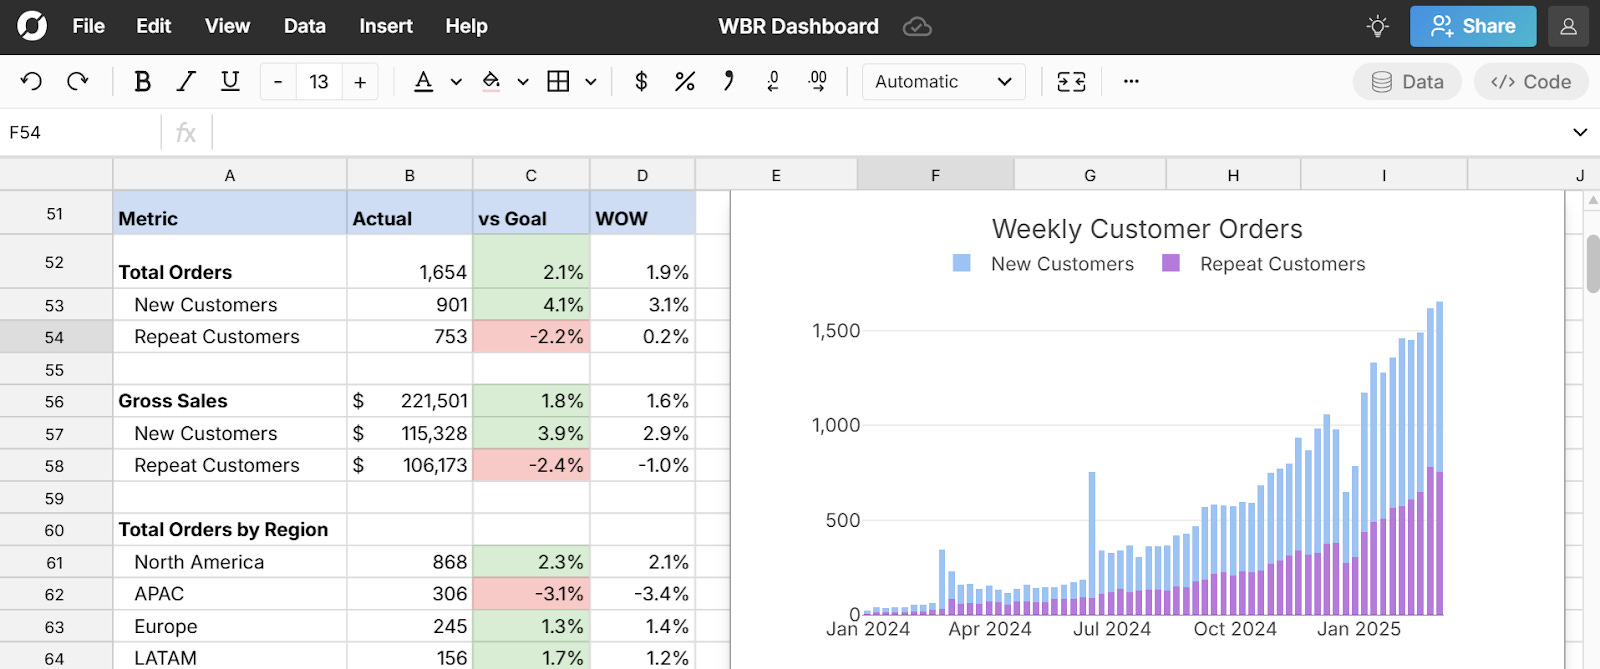
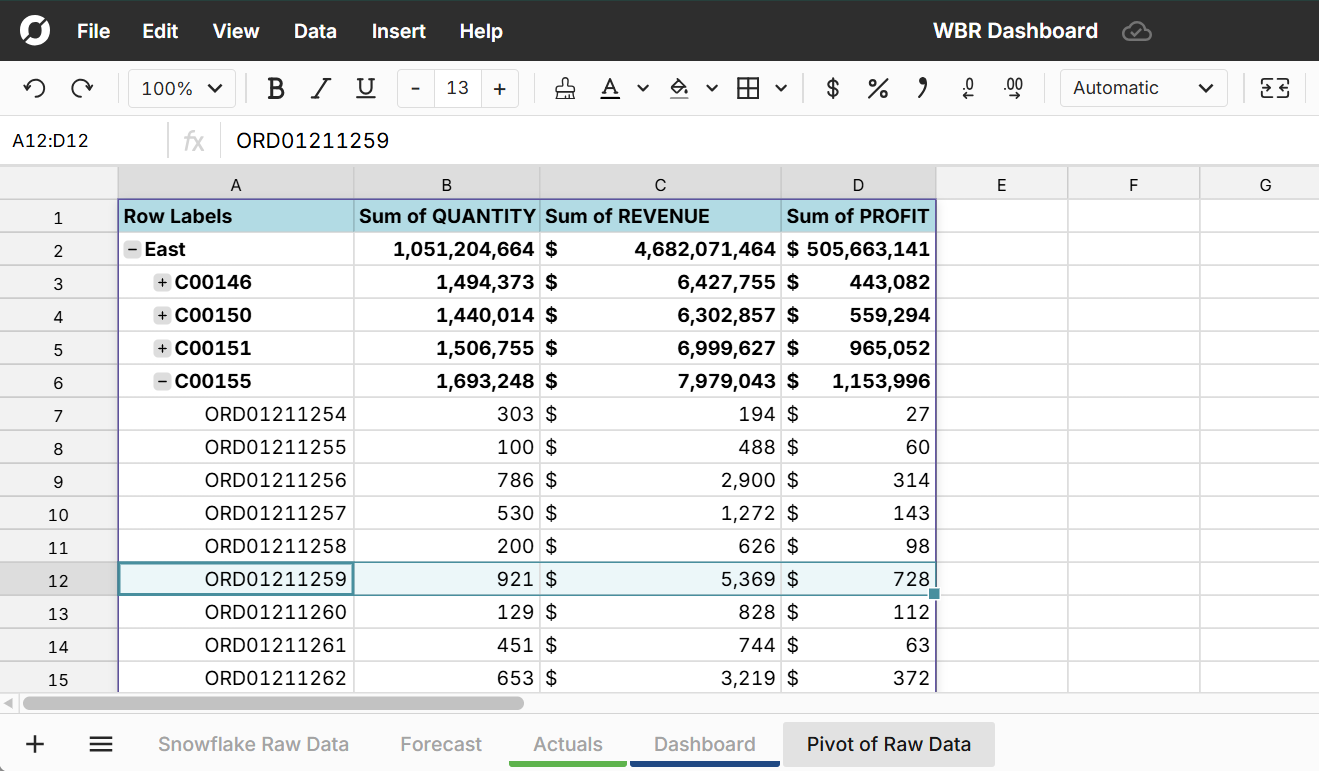
Once you’ve identified your metrics and source data, set up a connected spreadsheet or dashboard to track your metrics. For example, you can connect a Row Zero spreadsheet to your data warehouse - this keeps metrics automatically updated and also makes it easy for anyone to drill into the underlying data to investigate issues and opportunities. You can also use add-ins for Excel/Sheets if not working with large datasets. Avoid manual file uploads or copy/paste workflows to keep maintenance efficient, accurate, and secure.
Use conditional formatting to automatically format metrics to Green, Yellow, or Red to make it easy to see positive and negative metrics.
3. Review your spreadsheet/dashboard with stakeholders
Before hosting your first meeting, review your WBR spreadsheet with your business and data stakeholders to ensure you’re aligned on the right metrics and data sources. You don’t want these folks questioning the accuracy of the data in your first meeting - you want them questioning the reasons and implications of the metrics. Iterate if needed until you get to alignment.
Also, ensure every metric has an owner and ensure metric owners have direct access to the raw, underlying data, not just top-line numbers. This allows them to investigate root causes and come prepared with answers.
4. Schedule the Meeting
Put a recurring weekly meeting on everyone’s calendar. Most teams hold WBRs on Monday or Tuesday to review the prior week, but choose a day/time that makes sense for your org. Keep the meeting focused, but give ample time to review and discuss the metrics.
Plan for 30 minutes for smaller orgs, but larger teams will need 60 minutes (or longer).
5. Run the meeting
Typically, the data owner who compiles the metrics facilitates the discussion.
Review each metric methodically: Red, Yellow, or Green. Each metric owner should explain performance and any corrective actions, and attendees should feel free to ask questions. If metric owners don’t have an answer, they’re expected to follow up in writing after the meeting.
6. Track actions and follow-ups
Assign someone to keep a running log of follow-ups and action items. Send meeting notes afterward and check in on open items at the next WBR. Consistent accountability builds momentum and positions you as a leader for driving the process.
WBRs week to week
When done well, WBRs become core to your culture. They drive decision-making and keep teams aligned and accountable. If set up with a connected spreadsheet or dashboard, it takes no effort to update your core weekly metrics, and any prep time should go into reviewing metrics, investigating anomalies, and crafting a clear narrative for the week.
A lot of power and visibility come with owning the meeting and owning metrics, so WBRs can be a good opportunity to take a leadership role in your company. And don’t worry about getting it perfect right out of the gate. WBRs are an iterative process. The key is just to get started. Each week is a new chance to improve.
Thank you, Nick!
Find Nick:
LinkedIn: https://www.linkedin.com/in/nick-end/
Learn more about RowZero:
RowZero: https://rowzero.com/
Info on connecting Row Zero to your data warehouse: Databricks, Snowflake, and others. RowZero documentation: https://rowzero.com/docs.
YouTube: https://www.youtube.com/@Row-Zero
If you are a student or recent graduate, you can get a free Pro subscription. The platform lets you explore large public datasets, collaborate with others, and publish your research
Bookmarked case studies from Row Zero Blog:
 | A guest post by
|