How To Do a Root Cause Analysis - Issue 162
A framework for analyzing KPI decline and locating the root causes for unexpected user behavior change
Welcome to the Data Analysis Journal, a weekly data science and analytics newsletter.
📢📢📢 A quick note! I am on the lookout for 2 analysts-stars:
I am hiring a Product Analyst at MyFitnessPal to help us learn user behavior in the app.
BI Director/AVP to own BI and analytics at SageSure (reporting to VP of Data Science, with whom I had a chance to work before and have only good things to say!)
If you are located in the US and are interested, please apply!
Analyzing why events unfold the way that they do is both an art and a science.
Today, I want to focus on the “science” part and share an approach and framework for running a root cause analysis to understand unexpected user behavior change, event fluctuation, or metric decline.
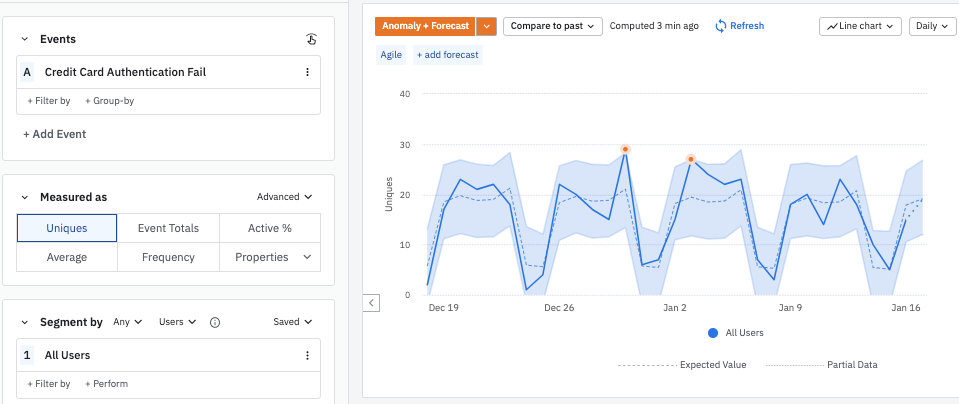
I remember being so excited when Amplitude launched its Root Cause Analysis (RCA) a few years ago - the feature that helps you locate anomalies in seconds to understand why events are changing:
Initially, I was obsessed with it, running RCA against every event fluctuation. And yet, it was not sufficient to answer why something stopped working or failed to perform. The tool pointed us to WHEN and WHERE the decline happens but didn’t help with WHAT and WHY. It helped (and still helps) us to run analysis and react faster, but much work is still needed to answer WHY something is happening.
A framework to analyze WHY the metrics decline
You would use root cause analysis for KPIs and metrics changes or unexpected user behavior patterns such as:


