
How To Measure Data Quality - Issue 185
Does data quality have ROI? Ways to measure and quantify data governance metrics

Welcome to the Data Analysis Journal, a weekly newsletter about data science and analytics.
Typically, I avoid data engineering and data governance topics in my newsletter. While the success of analytics is directly linked to data governance initiatives, measuring data quality often falls outside the primary responsibilities of data scientists. Also, the subject of data quality is well-covered today, and there is no need for yet another how-to-improve-data-quality publication.
However, a few weeks ago, during the ThoughtSpot webinar on data trends and data quality, a question arose about whether there is a common criteria for defining poor-quality data vs. good-quality data. To my surprise, Sonny Rivera's response was that (a) there is no industry standard to define criteria for data quality, and (b) it has to be “good enough.”
I respectfully disagree with (a), and the only context where I’d settle for “good enough” is when I am preparing my homemade fajitas.
That being said, I haven’t seen actual KPIs related to data quality. So, I embarked on a quest to find data quality metrics and KPIs I could use to scale the data governance initiatives and measure data quality. Below, after long hours of research, I share what industry leaders have to offer on this subject and my consolidated list of the top metrics you can use to measure data governance ROI and the state of data quality.
What data quality experts offer
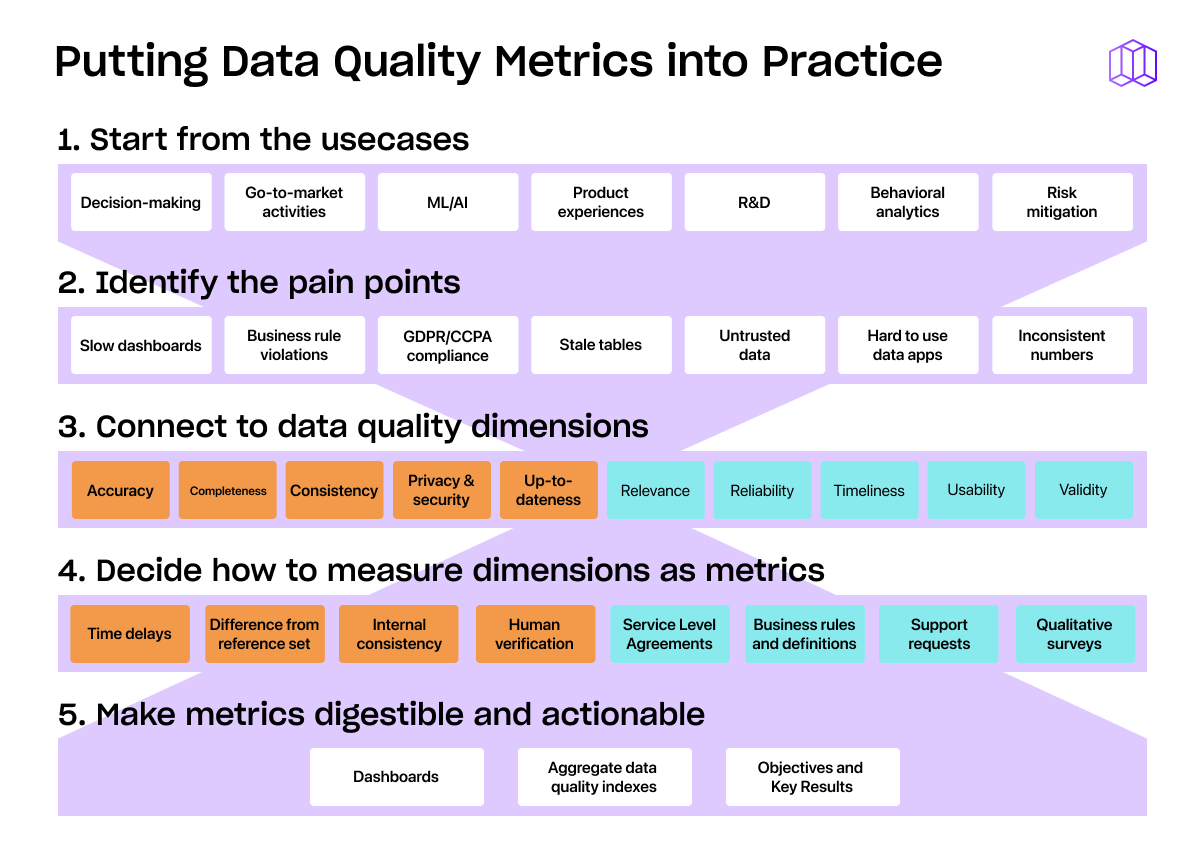
First, I checked (*)SELECT STAR blog, the company that is budgeted to solve your data challenges. With the over-promising title of How to Build a Modern Data Governance Framework, here is what they say:
This is the best measurement of data quality the company, which is solving data governance for $900/month, came up with through their 74 blog articles and videos. I found it hard to believe that a company of that scale and funding couldn’t cover the basics of data governance. So, I took time to listen to their videos, but most of them weren’t helpful.
There was one exception, though. During a live YouTube stream interviewing SELECT STAR CEO Shinji Kim, a question arose about measuring the impact of data governance. The host, George Firican, brought up several metrics, including:
time spent searching data
time spent handling data quality
cost-per-decision
the impact of data governance on some business-related metrics
Shinji mentioned the time to get compliant, the number of deprecated views and reports, the number of tickets the data team received, the number of solved tickets, and how many times the system(s) goes down because of data changes. However, these metrics primarily measure data team performance rather than the impact of data quality.
Like many of you, when I think of data quality, I immediately think of Chad Sanderson. He developed the concept of data as a product, introduced data contracts, founded a data quality camp community, and eventually co-founded a company solving data quality issues. For years, Chad was publishing and advocating for the importance of data quality. I’ve reviewed Data Products, read his guides, watched several of his talks, and am fascinated by the legacy he has created and his detailed approach to understanding and scaling data quality. Yet, I couldn’t find a consolidated high-level list of data quality metrics. I must be a bad detective.
Ergest Xheblati frequently discussed metrics, so I also went through his publications in his Data Patterns. I learned a lot of good insights and bookmarked a bunch. However, none of them focused on data quality metrics. Ergest often mentions SOMA in his publications (I encourage you to check this list of metrics definitions). While it’s really awesome, it primarily consists of business metrics and KPIs rather than indicators for measuring data quality.
Fivetran’s blog, as the “one platform for all your data movement,” referred me to articles on AI and database replication, which, unfortunately, were not particularly relevant. Data Governance vs. Self-serve was an entertaining read.
Perhaps Sonny was right, and there is no industry standard to define criteria for data quality.
Kevin Hu, CEO at Metaplane, the data observability platform, offers a guide - Data Quality Metrics for Data Warehouses (or: KPIs for KPIs):
He takes a step further by offering extrinsic vs. intrinsic data quality measurements, which, to me, seemed more complicated than necessary. The article discusses data quality dimensions and their importance, yet it still lacks specific metrics I could utilize.
Monte Carlo’s Guide on 12 Data Quality Metrics That ACTUALLY Matter presents metrics such as the number of data incidents, time-to-detection, time-to-resolution, table uptime, importance score, table health, table coverage, custom monitors created, number of unused tables and dashboards, deteriorating queries, and status update rate.
How And Why We Need To Implement Data Quality Now! by SeattleDataGuy serves as a good introduction to data governance. He breaks down data quality into 6 measurable pillars, offering examples and use cases for each:
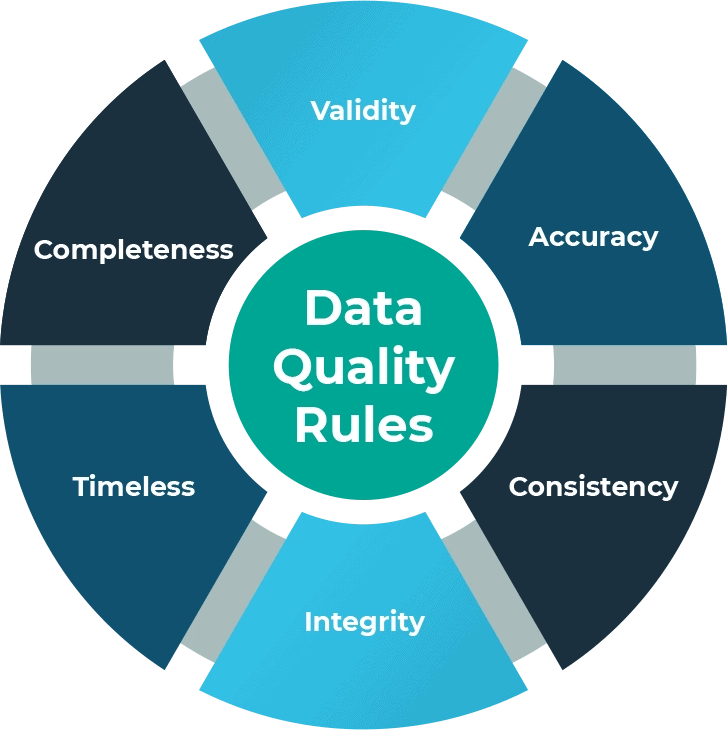
I am going to adopt his approach in creating my list of top metrics for measuring data governance.
How To Measure Data Quality
I noticed that data observability platforms tend to over-complicate the whole concept of data governance with confusing formulas, or introducing weird data ROI Pyramids, or developing data Maturity Curves.
As entertaining as it might be, I want to make the framework for measurement simple and clear, so I decided to condense multiple data quality pillars into only 3 sections with the following KPIs:
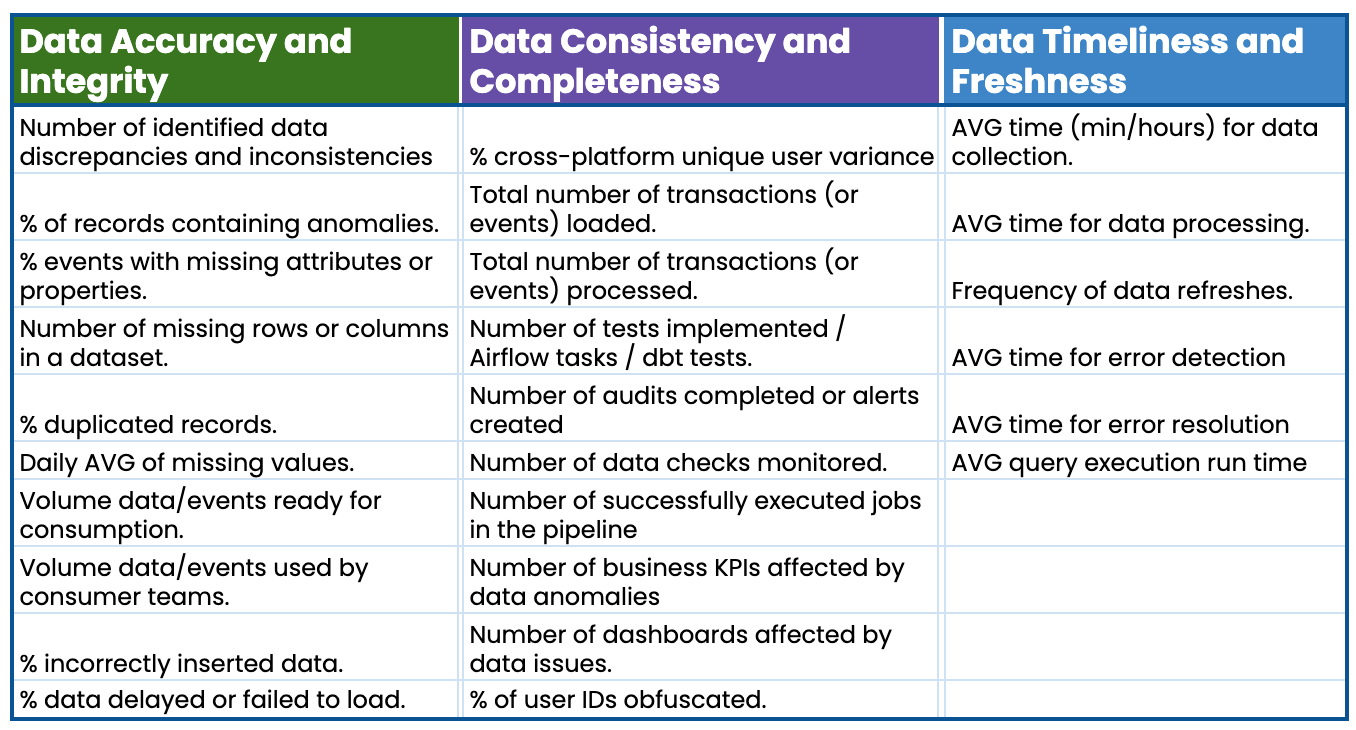
Data Accuracy and Integrity
Accuracy ensures that your data is error-free, precise, and has the right data structure, form, size, or range. It involves checking for errors, duplications, and anomalies.
Metrics can be used to measure accuracy and integrity:
Number of identified data discrepancies and inconsistencies
% of records containing anomalies.
% events with missing attributes or properties.
Number of missing rows or columns in a dataset.
% duplicated records.
Daily AVG of missing values.
Volume data/events ready for consumption.
Volume data/events used by consumer teams.
% incorrectly inserted data.
% data delayed or failed to load.
Data Consistency and Completeness
You measure completeness by comparing data against trusted sources. It represents the uniformity in data formats, labels, and definitions across many data sources. Your DAU in Mixpanel should have the same value as your DAU in Postgres, or Signups in GA should match with Signups in Snowflake.
Metrics can be used to measure:
% cross-platform unique user variance
Total number of transactions (or events) loaded.
Total number of transactions (or events) processed.
Number of tests implemented / Airflow tasks / dbt tests.
Number of audits completed or alerts created
Number of data checks monitored.
Number of successfully executed jobs in the pipeline
Number of business KPIs affected by data anomalies
Number of dashboards affected by data issues.
% of user IDs obfuscated.
Data Timeliness and Freshness
Timeliness is about data freshness, meaning having data when you need it. Ensure that your data is not only accurate but also up-to-date for relevant and timely insights.
Metrics can be used to measure timeliness:
AVG time (min/hours) for data collection.
AVG time for data processing.
Frequency of data refreshes.
AVG time for error detection
AVG time for error resolution
AVG query execution run time
I am not a data engineer (thank god), so it’s likely to be an incomplete list with missing important measurements. But at least it’s something I can now pass to the Head of Data to measure and scale the teamwork.
I am also frustrated that data experts who shape and influence modern data stacks today publish books, start companies, grow communities, and have enormous reach, and they don’t have these basics and essentials ready and available to borrow. (Most likely, they do, and it’s an issue of discoverability. That is partially a reason why we have to repeat each other over and over again.)
Thanks for reading, everyone. Until next Wednesday!
I still think we need to do a bit more here. These are great set of metrics but don't tell me the impact to the business in a simple way. For ex - What is the impact of fixing "Number of audits completed or alerts created". I think we need to imagine this like any other KPI tree and think of one or two metrics that communicate the impact to the business in a quantifiable way.
"I noticed that data observability platforms tend to over-complicate the whole concept of data governance with confusing formulas, or introducing weird data ROI Pyramids, or developing data Maturity Curves" ... THIS haha I 100% agree with your take on a simple, practical set of metrics
again, step one is just making sure data lines up from all platforms imo which is the 80/20 tbh