
How To Set Up Subscription Analytics For Growth Reporting - Issue 182
A deep dive into developing reporting for paid subscription metrics and lifecycle.

Welcome to the Data Analysis Journal, a weekly newsletter about data science and analytics.
Did you know there are over 1.17 million subscription apps (as of data from September 2023), and their growth is expected to increase by over 13% by 2025?
Subscription apps are currently the fastest-growing business model. Every day, more products and services (and newsletters) offer subscriptions, leading to a surge in demand for monitoring and measuring subscription growth and revenue.
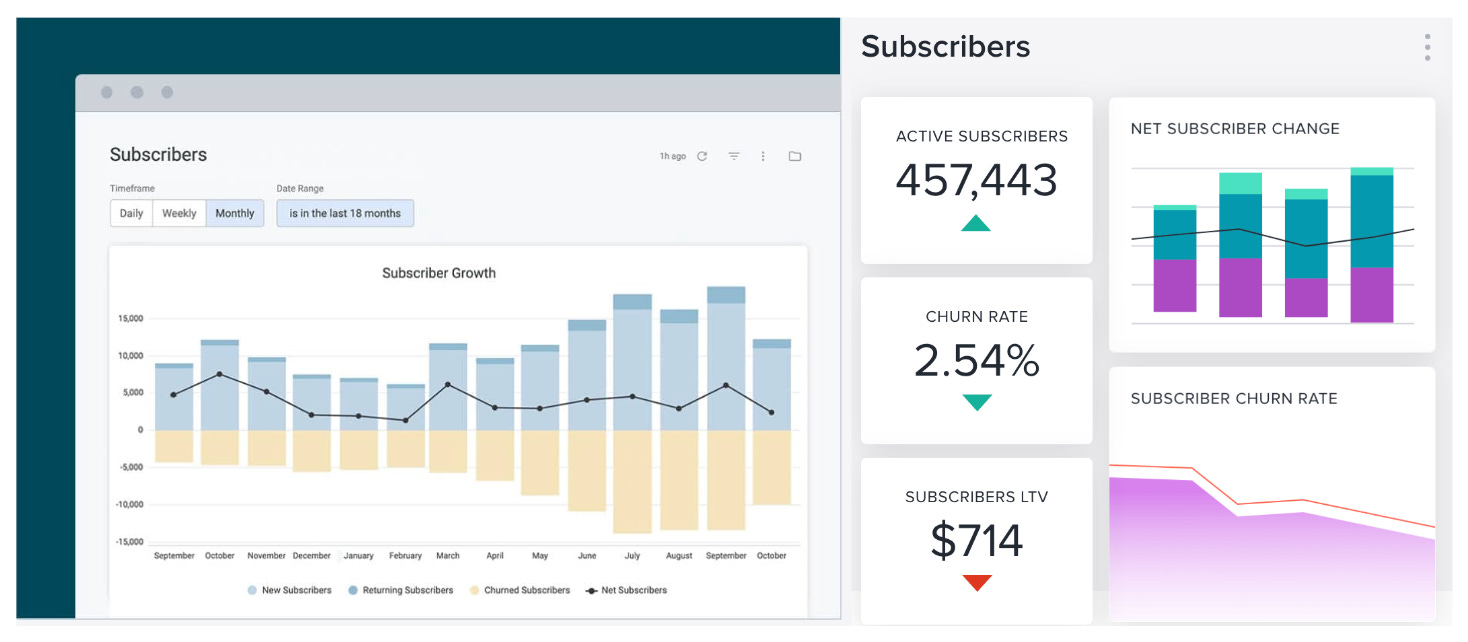
That’s why, over the past few years, we’ve noticed a wave of companies begin to deliberately target the subscription analytics space (e.g., Recurly, Chargebee, RevenueCat, ChartMogul, Qonversion, Paddle, Baremetrics, and many more). All of them bring the same value by offering dashboards and comprehensive subscription reporting into subscription metrics to help businesses optimize plans, pricing, subscriber acquisition, and revenue:
If you’re already taking advantage of such tools, this publication will be less relevant for you. That said, if your company is investing in data-driven decision-making via matured in-house analytics and data infrastructure, this article will help you understand how to work with subscription analytics. I will walk you through ways of properly setting up subscription analytics for reporting and point out common data challenges, as well as ways to solve them.
