
March Recap: The Gap Between Analysis and Communication - Issue 309
Your monthly recap of the latest trends, market shifts, and updates in data science and analytics.

Welcome to the Data Analysis Journal - a weekly newsletter on data science and analytics.
If you missed March posts, here’s the roundup:
2026 Benchmarks: More Apps, Less Quality - What RevenueCat and Adapty’s 2026 reports say about acquisition, conversion, retention, and where subscription apps are heading.
Before You Build an Analytics Agent - Getting started with agentic analytics: how to set up business context, benchmarks, and structured workflows
What AI Terms Mean for Analytics - A glossary of key AI, BI, and analytics terms shaping data workflows and decision-making.
March moved fast and felt overwhelming. We had the Gartner Data & Analytics Summit, along with a wave of new reports, launches, and product updates. April looks just as busy. Here are the key updates across data science and analytics: new case studies, analyses, and developments shaping where the field is headed.
But first, quick announcements:
Meet me at Apps in Motion in New York on April 8
Next week, I’ll be speaking at Apps in Motion on April 8 at NASDAQ in New York about driving mobile growth with AI. I’ll be joining FunnelFox, Adapty, and Paddle for a one-day conference focused on scaling subscription apps - from paid UA and web-to-app funnels to paywalls, payment infrastructure, and retention. Come say hi!
Stay tuned for a new SaaS analysis
I’m partnering with ChartMogul to test common SaaS and subscription app assumptions - to prove, validate, or reject them with data. A few weeks ago, we published More Plans, Faster Growth?, which showed a strong link between the number of plans a company offers and its growth and expansion revenue. Companies with more diverse plan catalogs tend to grow significantly faster in both net new customers and revenue.
The next report is even more exciting, and it’s coming soon!

🔊 Advocating for analytics
I want to share a report published by SignalVerified, a hiring platform, that argues traditional hiring signals, like résumés, interviews, and credentials, do not work especially well today, particularly for analytical roles.
What stood out to me is how closely the report matches what I have seen myself. There is often a gap between technical depth and communication. Analysts who do strong analysis sometimes struggle to present it clearly and make it easy to follow. On the other hand, analysts who write polished executive summaries and tell a strong story sometimes end up with weak reasoning, flawed methodology, and incorrect conclusions. Finding people who can do both well is rare, so I was glad to see a report that puts data and psychology behind the same pattern.
The team ran a pilot case study with the UC San Diego Data Science group, and I found the results both fascinating and very reflective of the current strengths and weaknesses in the data and analytics talent pool. Here are the key findings:
Polished output did not mean better reasoning. Some of the best-looking submissions had weak problem framing and conclusions that did not match the business decision.
Problem framing was the biggest differentiator. The strongest participants clearly defined the question they were answering and why it mattered.
Good analysis required restraint. Stronger submissions focused on what mattered most instead of analyzing everything available.
Technical depth alone was not enough. Even strong analysis fell short when it was not tied to a clear, useful recommendation.
Only a subset met the full bar. The strongest submissions combined decision framing, analytical rigor, and executive-level communication.
The team also shared the process they used to reveal capabilities that traditional hiring signals often miss. You can read more about it here - The Case for Verified Performance Evidence.
To me, this report proves why critical thinking has to come first when hiring analysts. It takes time and experience to build, and this is not something people quickly pick up overnight - Mastering Critical Thinking: How to Improve Your Analytical Skills.
🔥 March highlights
Metabase is stepping into AI with its context layer, Data Studio, which lets teams build and manage data models, define metrics, and organize metadata so analytics “stays understandable and reliable.”
Big news for Mixpanel users: the team launched Mixpanel MCP a few weeks ago. It’s now in public beta and lets you connect Claude or Cursor to Mixpanel to generate reports, search for events and properties, or compare insights with other tools in your stack.
Mixpanel also made its Metrics Trees AI-powered - Meet AI Metric Trees: Instant, structured growth frameworks. “Describe your business, product, or growth focus in plain language, and Mixpanel will generate a structured first draft of a Metric Tree informed by industry best practices.” I haven’t tried it yet, but if you have, curious to hear what you think.
Informatica from Salesforce + Microsoft announced a major expansion of their partnership that enables Azure customers to instantly connect 300+ data sources to Microsoft Fabric and create a governed, AI-ready foundation. They are also launching an Azure-based pod in Switzerland to help European enterprises meet strict data regulations requirements.
Congratulations to Preset for raising 7.27M Series C round led by a16z. I like Preset and share team values for open analytics and BI, and I’m curious to see how the company continues to grow.
📈 New industry reports and benchmarks
2026 State of Digital Analytics from Mixpanel
State of in-app subscriptions 2026 from Adapty
2026 Practical Data Community State of Data Engineering from Joe Reis.
⚙️Know your craft
How best-in-class teams do it
Grammarly: Data Scientists: How to Own the Product and Thrive in the AI Era from Eric Weber
Ikea: Bayesian statistics for confused data scientists from Nicolas Chagnet
Booking.com: Scaling Experimentation Quality
Datadog: The Core Values of Experimentation from Ryan Lucht.
📚 Weekend Longread
ETL is Dead - a wonderful write-up by Ananth Packkildurai on why the shift from human-operated to agent-operated data warehouses demands a new architecture and mindset.
🎓 Tutorials
Dagster launched an AI-driven data engineering course. It takes 2-3 hours to complete if you already have experience with Dagster. If you’re new to data engineering, check Dagster University.
My Models Failed. That’s How I Became a Better Data Scientist - a step-by-step guide on how to turn raw data into a readable industry report.
The Causal Inference Playbook: Advanced Methods Every Data Scientist Should Master.
30 A/B Testing & CRO Stats Every Optimizer Should Know in 2026 - a collection of 30 stats across industry adoption, experiment types & velocity, and test quality.
Uber Data Scientist Interview Guide: Process, Questions & Preparation Tips:

🔥 New Tools Worth Exploring
Not sponsored. No affiliate links. Just tools I genuinely recommend.
Chartle - Quick charts in seconds. Type what you want or drop in your data, and get beautiful interactive charts you can share anywhere.
NotebookPress - Fellow blogger Tivadar Danka from The Palindrome built this notebook tool to help writers publish Jupyter Notebooks on Substack (and other platforms) in just a few clicks.
AMERICA in DATA - a fun quiz game that makes raw numbers more interesting and a little addictive.
⛔ Hot Seat
Recent takes I’m not fully buying.
Will AI Kill Spreadsheets? - Tell me you’ve never worked in finance without telling me you’ve never worked in finance.
❤️ Favorite publications this month
Bookmarked to re-read favorite takes
Dashboard rot as org attention grave markers from Counting Stuff
The Math That Explains Why Bell Curves Are Everywhere from Joseph Howlett
Layer by Layer, We Built Data Systems No One Understands from SeattleDataGuy
Experimentation at Scale Is Not About Speed - It’s About Leverage from Lorenzo Mariotti
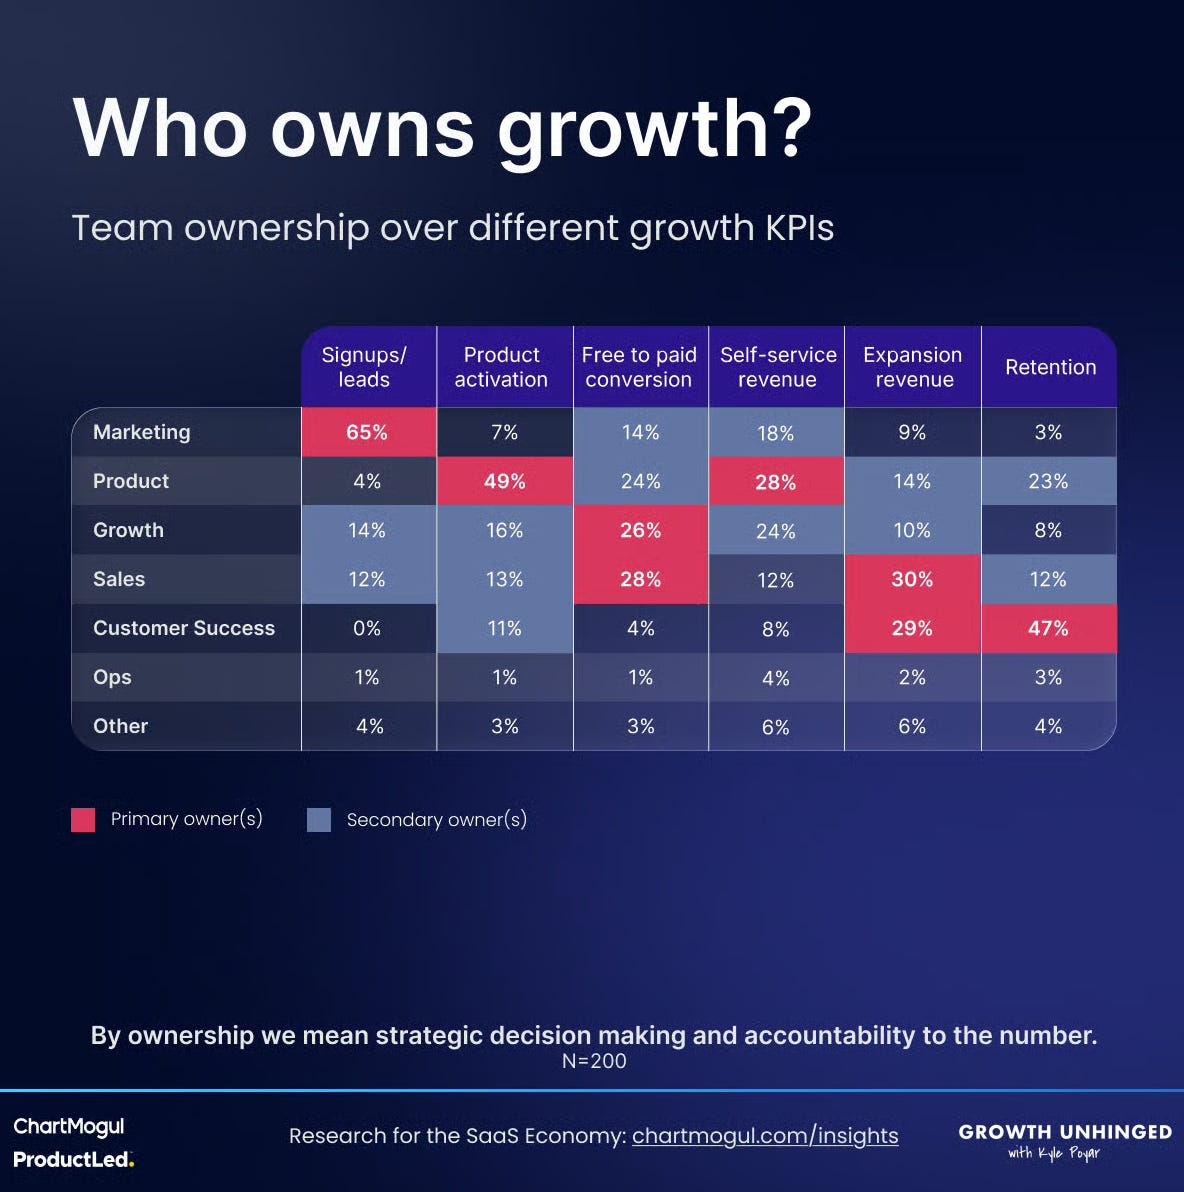
📊 Monthly Chart Drop
Remember my venting in Who Owns Growth? (And Why Analytics Pays the Price)?
Well, ChartMogul just conveniently published the answer:
✈️ Upcoming events in April
April 1-2, Los Angeles: DigiMarCon (Techspo)
April 8, New York: Apps in Motion
April 9, Amsterdam: Emerce Conversion
April 13-15, Kissimmee, Florida: Qlik Connect
April 14: London: Data Science Festival 2026
April 14-15, online: Applied Healthcare AI Summit
April 15-16, New York: AI in Finance Summit
April 14-16, Redwood Shores, CA: Oracle Analytics and Data Summit
April 18, Amsterdam: MeasureCamp Amsterdam
April 22-24, Las Vegas, NV: Google Cloud Next
April 24: Stanford: Stanford Causal Science Conference
April 28-29, Santa Barbara: Marketing Analytics Summit
April 28-29, São Paulo, Brazil: Conferência Gartner Data & Analytics 2026
April 28-30, Boston: ODSC East 2025
Also, check this calendar for the full list of data and analytics events this year - The Biggest Data, Analytics, and AI Conferences of 2026.
Thanks for reading, everyone!
Strong roundup showing how analytics is shifting from pure reporting to decision-making, communication, and real product impact