
Refresher on SQL for Data Analysis - Issue 238
SQL solutions for data analysis, ad hoc, and modeling.

Do you know what's best to do on Christmas morning? Learning SQL.
One last refresher from me this year, and maybe the most important one - SQL!
Today, I share a quick refresher on SQL with my solutions for common data analytics projects I had to go through many times over my tenure as an analyst. I hope it will help you advance and save you time. Read below:
SQL for getting blended retention and cohorted retention
SQL for ranking the top-used product features
SQL for frequency of usage analysis
SQL for weekday product usage analysis
SQL for getting average logins per user per day
SQL for getting adjacent user persona
SQL for getting a random set of users for ML and analytics
SQL for flattening JSON
How to model tables for subscription reporting
How to join 2 tables that are not related by a foreign key relationship
SQL for getting retention and cohorted retention
I have about 4-5 different SQL queries for retention, depending on the table structure, the definition of retention, and the product. Most analytics teams end up creating models for retention in a specific format. For example, it’s common to create an active_user table and assign flags to every user for R(D1), R(D7), R(Day 30), and so on. Having such a consolidated table makes it easy to pull retention data, as you don’t need to run calculations or use CASE statements in every SQL query to pull retention KPIs. However, it takes time to create these views.
Here are some of my SQL examples for blended and cohorted retention - How to measure cohort retention.
SQL for ranking the top-used product features
You can’t just come in and run a query to get the top-used features out of the blue. You need to have user activity already mapped to the features table, which is not trivial when you are getting activity data from event streams. Translating raw events into defined user actions (e.g., onboarding completion, dashboard usage, logging activity, item browsing, etc.) takes time. On top of that, merging and mapping this data with subscriptions, DAU, or attribution is even harder.
More often than not, teams simply store user actions (such as cta_click, screen_view, profile_updated, etc.) as a proxy for features. You may have a table with activity_type that includes signup, purchase, login, home_screen_view, profile_updated, and other granularity in the form of raw events and actions users create while using your product. But user activity is not the same as a product feature. Activity may contain clues about which parent features the user clicks and views belong to. If you are less lucky, you will need to map the action data you have to features. In any case, you have to start with getting the higher activity type and then work on mapping them to features.
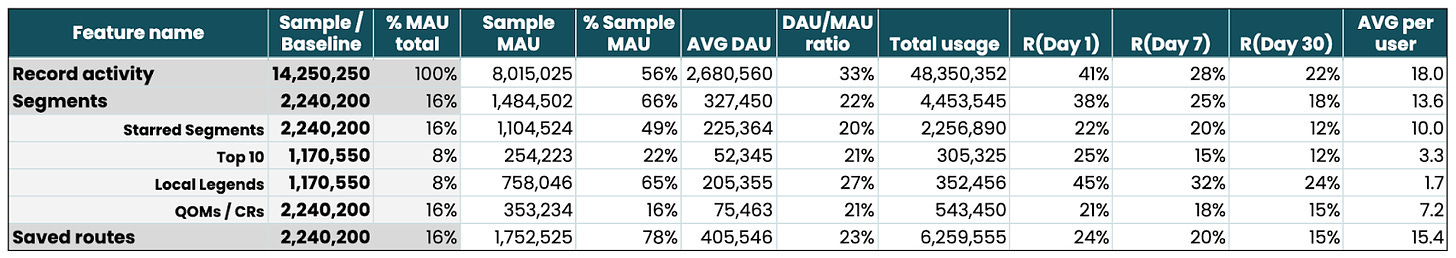
Here is how I do it, along with my SQL solution for getting top-used features - Ranking The Top Used Product Features.
SQL for user frequency of usage analysis
Your product may be intended for episodic use instead of daily (Airbnb, Lyft, Tinder, Dropbox, LinkedIn), so your DAU/MAU ratio could be small regardless of high volume usage, which isn’t that helpful to illustrate your true user engagement. You are most likely to have a few small groups of power users driving daily usage, while other product personas prevail in bi-weekly or monthly usage.
