
September Digest: From Dashboards to AI Spreadsheets - Issue 225
Case studies, analyses, and new tutorials you may have missed.

Hello, analysts! Happy October! Last month, paid subscribers learned about:
Applying Regressions in Analytics - How to interpret regression plots and understand the equation that drives analysis and predictions. What are the common use cases across different regression types? Examples of product and marketing hypotheses that can be solved with regression.
Subscription Upgrades and Downgrades: A Deep Dive into B2C vs. SaaS Reporting - Common mistakes and nuances of subscription reporting, along with different methods for setting up analytics to report upgrade and downgrade KPIs.
Frequentist vs. Bayesian: Which Method Should You Choose for Your A/B Testing? - The pros, cons, and use cases for Frequentist and Bayesian approaches when analyzing A/B test results.
I was supposed to be back today with
, for our infamous monthly recap, but honestly, I’ve fallen behind. I’m putting this issue together at the last minute, so I’m hoping Timo will forgive me for publishing this September recap on my own.If you’ve just joined this newsletter, once per month (and yes, it will be monthly!) I share a recap of all things analytics. My goal is to entertain you with new case studies and analyses, event recaps, and news related to analytics and data science to help you get better at your job. And, of course, to advocate for better and more trusted analytics because, let’s face it, nothing is more exciting or important - no matter what product managers or data engineers might tell you.
🔥 September highlights
On my side, September was busy:
🔵 I introduced a new template for a Mobile Subscription App Engagement and Retention Dashboard for Amplitude users. The dashboard tracks metrics such as the DAU/MAU ratio, average usage per user, app usage frequency, MoM views, and more, offering a comprehensive view of user engagement and lifecycle. I’ve started using it for the apps I work with, and it literally takes less than 40 seconds to set up. Simply choose your top activity event (login, app_open, or session_start) and the top actions you expect users to do in the app and you are all set. Read more: How to use product data to drive user engagement and retention, or let me know if you need any help.
🔵 I am working on a book in partnership with O’Reilly and looking for a co-author to help make ML interesting again. Is this you? My focus is on ML clustering algorithms, so if this is something you’re passionate about, let’s collaborate!
🔵 I partnered with Thomas Schmidt from Metabase on a fantastic guest writer post: How to Communicate Data Effectively. I say “partnered”, but really, Thomas did all of the work 😂. It is one of my favorite publications now.
In other news:
🟠 Meet Paradigm - the first intelligent spreadsheet. Do you remember when I told you that 2024 would be the year of spreadsheets? Well, Guess what! Here’s yet another AI-driven spreadsheet (Y2024) that aims to save you from “countless hours wasted finding and analyzing data.” Let’s see if we can get 2 more NextGen spreadsheets before the end of December to make it a dozen.
🟠 Medium just became profitable: That’s right - the largest social publishing platform, Medium, which has been around since 2011, finally became profitable (13 years later). They also surpassed 1M subscribers in April 2024. An interesting video about their growth, values, and the state of blogging - Medium: Reaching Profitability while The Internet is Broken + CorePod.
🟠 Optimizely acquired NetSpring:
“With this acquisition, Optimizely will be the first DXP to provide “warehouse native” analytics, enabling customers to tie experimentation and other digital experience activities to business metrics and outcomes that resides in customers' data warehouses.”
🟠 Amplitude partners with HubSpot: Hubspot is one of the top destinations for data in Amplitude, and now there is a seamless integration to please marketers.
🟠 Mixpanel launched Session Replay:
“Mixpanel Session Replay is the fastest way to understand the whole picture about your customers and make better product decisions, by combining quantitative and qualitative user insights.”
🟠 Deepnote released the Big Number Chart: My favorite ML notebook is slowly becoming another BI dashboard 😢 We have enough dashboarding apps. Can we please-please have a proper notebook?
⚙️ Know your craft
A Guide To Charts from Tableau.
A new paper from Evan Miller - Likelihood-ratio inference on differences in quantiles, offers ways to improve the computation of getting the differences in quantiles across the two experiment groups.
R advantages over Python. It’s a long list…
The Analytics Development Lifecycle from dbt.
Behind the Scenes of SQL: Understanding SQL Query Execution from
.
🤓 Analysis and case studies
Finally, one of the most comprehensive LTV guides published by Paul Levchuk: LTV forecasting followed by his recent piece - LTV forecasting — battle for accuracy.
A curated collection of A/B test results from best-in-class apps.
Introducing user states in product analytics from Hipster Data Stack.
Are You a Dalia? How We Created Data Science Personas from Spotify Analytics team.
Fixing Bias: How Error Analysis Improved My Water Forecasting Model from
.
❤️ Favorite publications
Bookmarked to re-read favorite takes
The Vertical SaaS + Payments Playbook from
.The Paradox of Self-Serve Analytics from
. The reality is that “interesting” insights often bring more doubt than clarity. I couldn't have said it better.- : “How has the fund performed? Imagine what can be, unburdened by what has been.”
The Data Engineering Megatrend: A Brief History from RudderStack. How it all started. How it’s going. Love it.
And related - A timeline of R's first 30 years.
📈 New industry reports and benchmarks
Data Teams Survey 2024 Results from Jesse Anderson, Big Data Institute
The New Normal For SaaS - Net Revenue Retention trends and benchmarks from ChartMogul.
🗓️ Recap of some recent events:
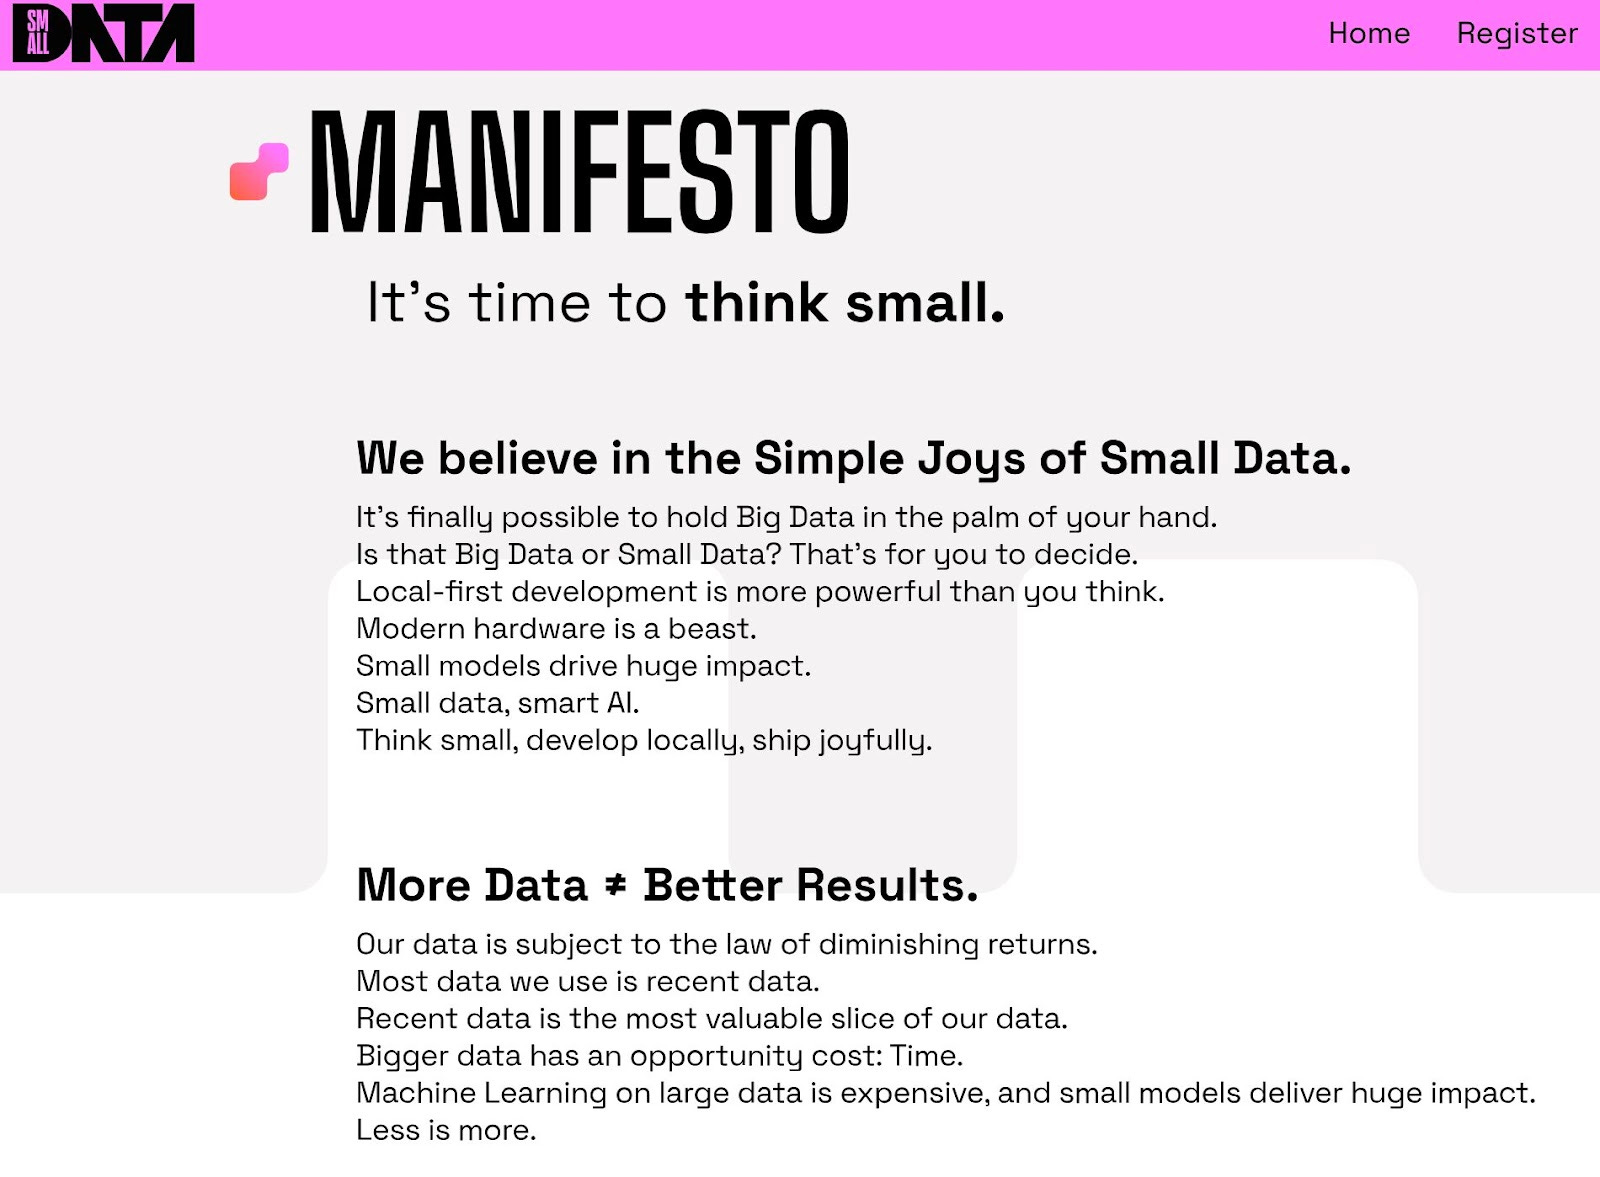
🟣 Embrace the Small Data movement: We went through the Big Data era. Now, apparently, we are entering the age of Small Data.
What matters is that data is data, and none of the adjectives will help when you’re a VP of Analytics who doesn’t understand the difference between structured and unstructured data or OLTP vs. OLAP. So, get your basics covered first. I appreciate MotherDuck, PySheets, Quarto, and Ravit Jain for helping us get there.
🟣 AirByte 1.0 launch: It was a pleasure to join the launch last week and get emotional as Michel Tricot reflected on their exciting but challenging journey from their first connectors in 2020 to Series B:
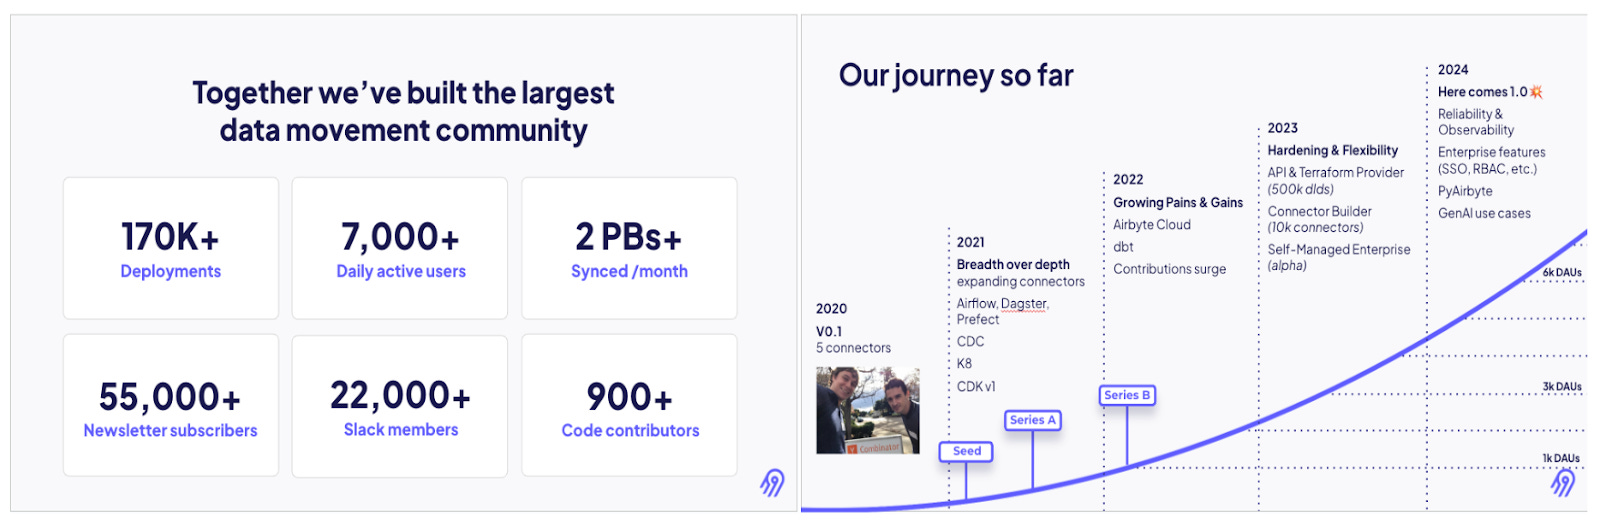
Thank you, AirByte team, for inviting me to celebrate your special night! The syncs are smoother, and data pipelines are better now as the team continues releasing new connectors and providing more enterprise support. Airbyte can now create API connectors by reading the docs.
🟣 SaaStr Annual 2024 was interesting… Contrary to the expected AI hype, the theme focused on managing and reporting financial data, with a spotlight on CFOs and SaaS financials, which was a pleasant surprise for me. Top it off with the opening from my favorite SaaS veteran, Christoph Janz, and his overview of key SaaS KPIs and cohorts, which made it the best SaaStr event I’ve attended yet.
🟣 App Growth Annual 2024 - A very important event for mobile apps. RevenueCat’s first-ever conference covered topics like paywalls, targeting, experimentation, ads, and growth strategies. With over 40K mobile apps, if anyone can share the best practices on mobile, it’s RevenueCat.
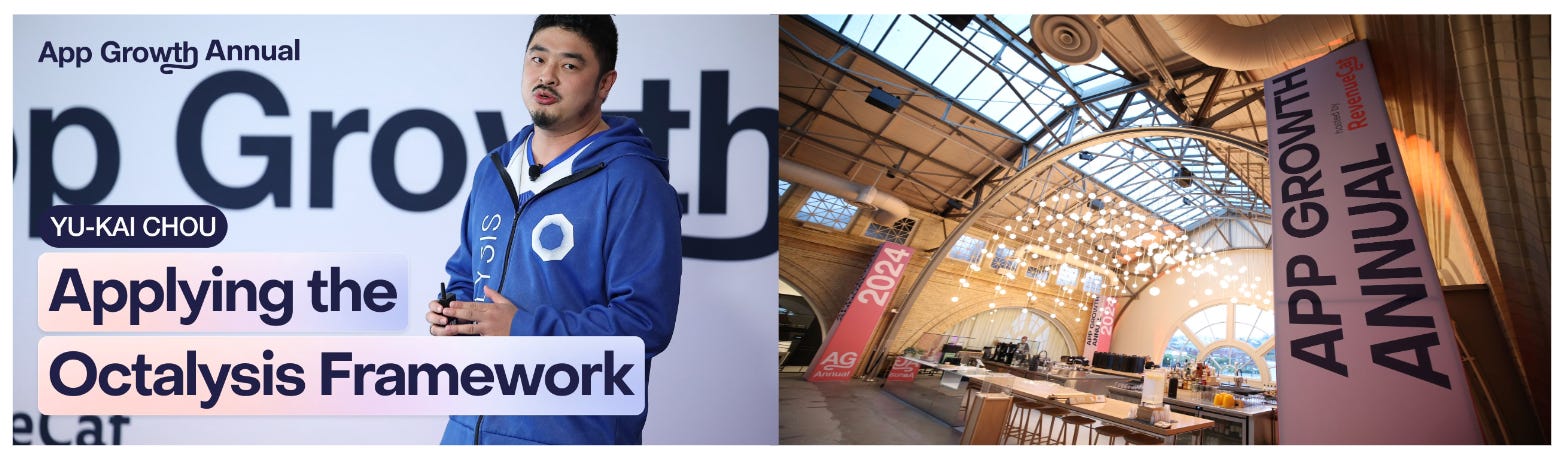
I loved seeing colleagues and friends, meeting Jacob Eiting, and finally catching up with
and . I had planned to publish a recap with all the learnings, but Sylvain beat me to it. Enjoy and welcome - App Growth Annual Recap:
Thank you for reading, until next Wednesday!
Great meeting and chatting with you too!
And this conversation seems familiar :) https://dataanalysis.substack.com/p/frequentist-vs-bayesian-which-method