
The Guardrails AI Needs for SaaS and Subscription Reporting - Issue 325
How to build a subscription waterfall that gives AI the guardrails to keep churn, revenue, and subscriber metrics accurate

This publication is for anyone working with subscriptions or SaaS, who wants to hand recurring reporting over to AI without losing trust in the metrics.
I’ll explain how recurring reporting should be set up for SaaS vs B2C subscriptions and share the framework I use to keep churn, ARPU, revenue, sales, and active subscriber metrics accurate and aligned.
I’ll also show you how to task AI with monitoring these metrics, identifying inconsistencies, and maintaining that alignment over time.

AI cannot fix a reporting framework built on the wrong assumptions.
SaaS and B2C subscriptions may share the same basic lifecycle, but their billing systems, customer volumes, plan structures, and definitions of churn and active subscribers are very different. Before giving reporting to AI, you need to account for those differences - or AI will simply automate the same inconsistencies faster and with more confidence.
SaaS reporting frameworks don’t work for B2C subscriptions. We use them anyway.
For reference, here is how I classify the companies discussed in this publication:
SaaS: Asana, Slack, QuickBooks, Figma, Zoom, and Atlassian.
B2C Subscriptions: Calm, Duolingo, Strava, Netflix, Spotify, Disney.
Do not confuse them with:
B2C Transactional (one-off payments): eBay, Amazon, Temu, Uber, Airbnb.
B2C Social (Ads): Twitter, TikTok, Facebook, Instagram, YouTube, Messenger, WhatsApp.
Enterprise SaaS: Salesforce, Workday, IBM, Oracle, Adobe, and Microsoft
Large enterprises: Wells Fargo, Kaiser Permanente, Mercedes-Benz, and government agencies such as the FBI
This publication focuses only on the first 2 categories: SaaS and B2C subscriptions.
Here is a shocking reveal: B2C is very different from B2B.
At first glance, if you think about a subscription lifecycle (New Subscription → Renewal → Churn → Winback), it looks quite similar to SaaS. So, it seems logical that typical SaaS reporting (Start Period customers → New customers → Churn → Net New Customers, all tied into ARR) should work.
And it mostly does - with some adjustments. But things start to go wrong once you introduce more payment providers, more plans, or you need to report on expansion and contraction.
I run into this problem a lot: fast-growing B2C companies often bring in interim CFOs and COOs with traditional enterprise SaaS backgrounds. CFOs expect subscription reporting to follow the same rules they already know, and they make my life miserable when it does not. And I struggle to explain that YouTube or Netflix reporting should be different from analytics at IBM or Mercedes.
I spend a lot of time explaining that the concepts are similar, but the mechanics are not. Churn works differently in B2C, ARR is often the wrong anchor, and even something as basic as an “active paid customer” may require a completely different definition. If those differences are not addressed, every downstream metric, from ARPU and revenue to retention and subscriber counts, can quietly drift out of alignment.
If you need help explaining to your CFO why a 2% reporting accuracy threshold won’t work for your app (either mobile app or web B2C subscriptions product), send them this:
Why SaaS reporting breaks in B2C subscriptions
1. Quicker user lifecycle:
The average subscription retention for mobile apps is 3-4 months. In B2C and especially in mobile apps, users cancel and switch between plans far more frequently than in SaaS, where annual contracts or longer billing periods are the norm.
Some billing systems record plan changes by ending one product ID and creating another. In 90% cases, without additional logic that you apply with SQL, upgrades and downgrades are misclassified as churn followed by a new subscription, inflating both metrics.
2. Too many SKUs or product IDs:
In SaaS, you typically work with 2-4, maybe 6 plan types:
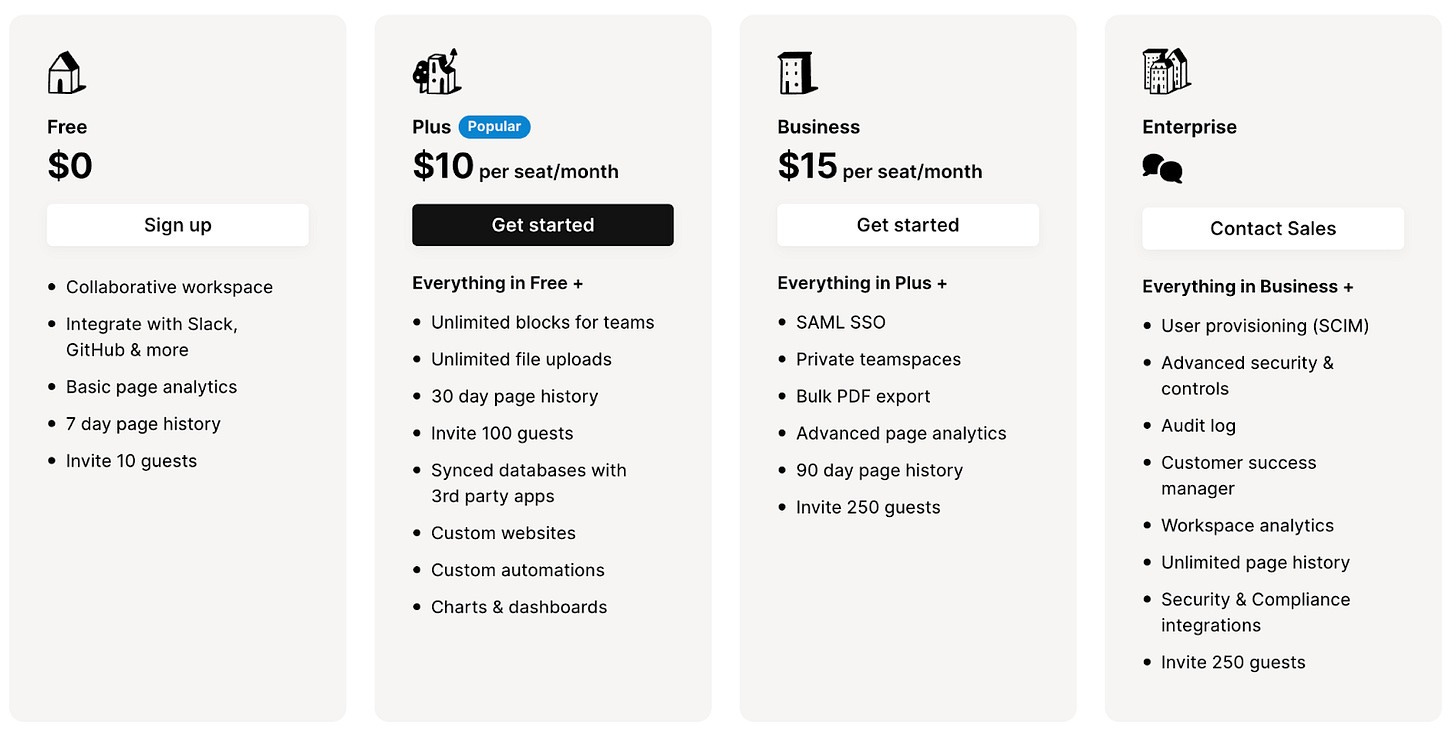
It’s simple to hardcode these plan movements in your data layers. In mobile apps, however, you could easily be dealing with 80 product IDs or 40 SKUs. In one extreme case, I had to deal with 248 unique product IDs and report on user movements (upgrades and downgrades) between them. Don’t do it. Nothing good comes from it.
3. Self-serve vs. guided onboarding:
In SaaS and B2B, customer onboarding is often assisted by account representatives who guide customers through each lifecycle stage, including renewals and upgrades. As a result, reporting is often handled manually. There may be no concept of a “signup,” and reporting is typically built at 2 levels: the organization level and the individual customer level.
Your most important metric is beginning customers, which typically serves as the denominator for most other metrics.
In B2C apps, tens of thousands of users move through standardized onboarding flows and paywalls. Your analytics must account for skewed distributions and large numbers of outliers, and every stage of reporting needs to be automated.
Your most important starting metric is signups or installs, which serves as the primary denominator for most other metrics.
The expectation for reporting accuracy is also different.
In SaaS, you are expected to keep discrepancies below 2%. And that is often easy:
You may have fewer than 10K paying customers, with a small number of “whales” on expensive annual contracts. You can practically count them on your fingers and validate every customer ID across the 2 or 3 systems - Salesforce, Stripe, and monday.com. Everything is reconciled in one large spreadsheet everyone knows about, and financial forecasts can be precise and clean.
In B2C subscriptions, a 20% discrepancy can feel like a good outcome:
You may have more than 500K paying customers spread across weekly, monthly, 3-month, 6-month, annual, and lifetime plans. Some come with a 1-week trial, others with 1-month. Some have no free trial. Payments come through Apple’s App Store, Google Play, Stripe or even PayPal, each operating as its own processing system and database.
There is no single, consistently reconciled source of truth. RevenueCat, Chargebee, Baremetrics, Recurly, and Adapty all show different numbers. Calculating the total number of active paid subscribers in your database requires a long SQL query, and the result still differs from the number your CFO has.
Even after months of cleaning and reconciling the data, you still don’t know whether your “active subscriber” count includes free trials. In theory, it should not. But then why is it so high?
If you’ve been there - bookmark this publication. The framework below will keep your sanity and metrics aligned.
One framework that keeps subscription metrics aligned
I have trust issues. I don’t trust the reporting in RevenueCat, ChartMogul, Adapty, or Baremetrics. I have worked with subscription data for 10 years, and I have yet to see churn rate or LTV reported accurately by a 3rd-party tool.
So, when I start working with a new app that offers recurring products, the first thing I do is build a subscription waterfall. I try to build one separately for iOS, Android, and Stripe, and then map all payment providers together.
This gives me a baseline for where the metrics should be, compared with what 3rd-party tools report. It also helps me establish the range of natural variation in each metric. Later, I can give those thresholds to an AI agent and have it flag unexpected deviations.
