The Ultimate Guide To Product Features Analysis - Issue 184
How to locate top-used features in your product and understand which features drive the highest user engagement in the app.
Welcome to the Data Analysis Journal, a weekly newsletter about data science and analytics.
I am excited to share that my new publication was featured on the Amplitude blog yesterday!
Make sure not to miss it:
The Ultimate Guide to Product Features Analysis
If you are a product owner, product manager, or data scientist working with product analytics, this is a must-read 10-page guide to learn:
Which product features are the most popular and drive the highest growth and engagement?
What are the feature value and ROI of product initiatives?
What features are the strongest candidates for optimization, monetization, or paywall?
And which should be sunsetted?
You need to do a feature analysis to understand your value proposition, appropriately package your pricing, tailor your messaging and GTM strategy, prioritize product initiatives, discover opportunities for new feature development, and simply connect with users more.
In this guide, I offer my framework for doing a feature usage analysis that can be done in popular product analytics tools like Amplitude or Mixpanel. I have used this approach at VidIQ, Change.org, and now at MyfitnessPal, as it’s applicable for most B2C, B2B, and SaaS apps and is easy to borrow and interpret. I use MyfitnessPal and Strava as app examples and demonstrate my analysis in Amplitude.
I am sharing a few key takeaways below. Please read a full guide here: The Ultimate Guide To Product Feature Analysis.
Why feature analysis isn’t easy
It requires detailed data tracking: what makes feature analysis unique and challenging is that unlike root cause analysis, activation analysis, personas, or activity frequency analysis, for feature usage, you need to have every user action in the app or website tracked, and this tracking should be mapped to the appropriate feature (or a group of features) classification.
It depends on matured analytics: Depending on your product's nature and maturity, this task can be daunting and can require comprehensive documentation, catalogs, or taxonomy.
It’s not adaptable: There is also no plug-in template or easy solution to fit all features because every product is unique and has its own functionalities.
Getting started with feature analysis:
Align on definitions of a feature
There is no hard-coded definition of what a feature is or should be, and it’s up to your product team to align on the functionalities you wish to consider as features. It can be a mix of ML-based recommenders, notifications, and in-app screen modes and settings. Some features may not necessarily require proactive user interaction (e.g., dark mode screen view, no-ads experience, reminders). Measuring engagement for such features is very tricky.
Cluster or group your features
Some features can belong to multiple groups or clusters (e.g., in the Strava app, posting an exercise on the newsfeed can be part of the Activation, but it can also belong to the Community features or belong to the Progress tracking). Such features naturally will have more volume of usage, but this does not necessarily mean they are more popular. To address this, you can bucket features into clusters or groups and set a baseline of expected usage for every group to ensure you do not over-count usage. For example, features can be grouped into community, onboarding, core, creator, etc.
Identify transitional features
Users often have to use one feature simply to access another they intend to use (e.g., a dashboard in the Apple Health app can be a feature itself, or it can also be a path to other health reports). You need to have a way to differentiate and, if needed, exclude transitional usage from the actual feature usage. Read a full guide to learn some quick ways how to do this in Amplitude.
Recognize features are dynamic.
Every company iterates and expands its offerings. For example, in the past year at MyFitnessPal, we released many new features, such as Dashboard, Intermittent Fasting Tracker, Glucose insights, Personalized plans, and more, while also continuing testing and iterating. The feature analysis I ran last year is no longer applicable today, unlike my analyses for Personas, Activation, LTV, or Retention. You have to revisit your feature clusters to make sure they are still appropriate, and their tracking hasn’t changed.
Steps for feature analysis:
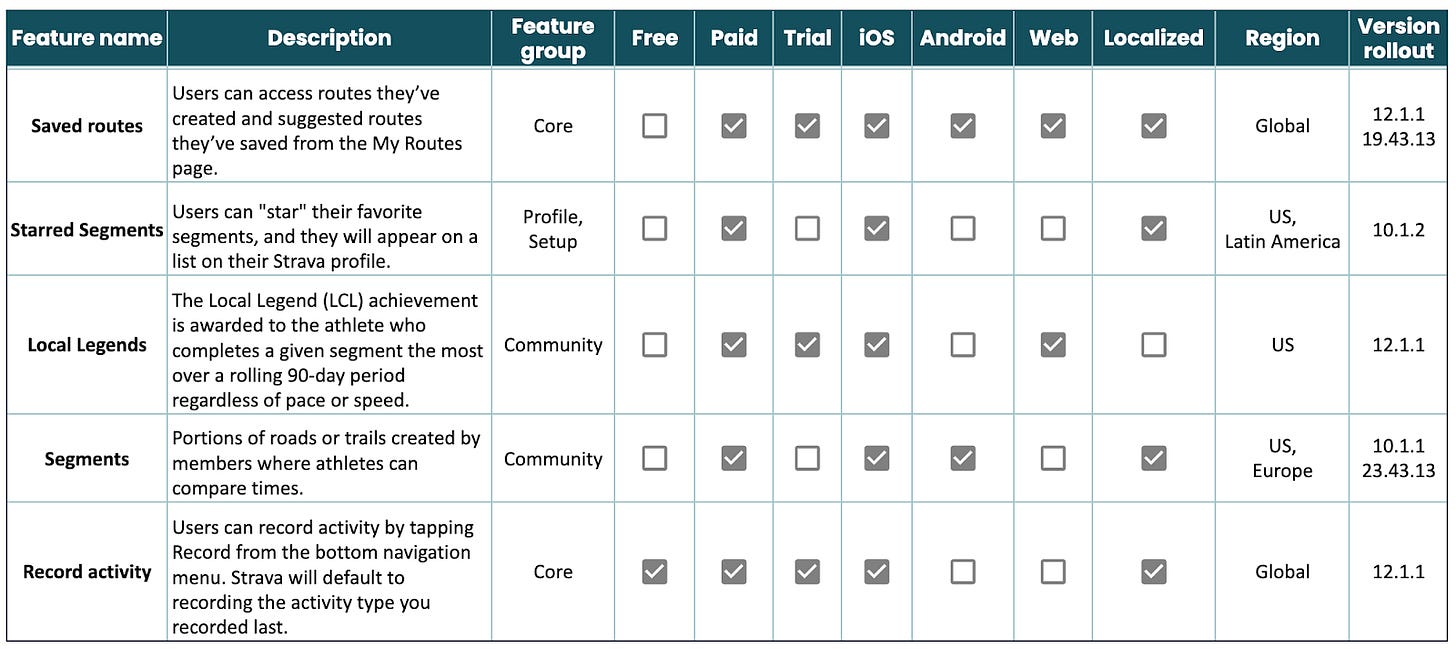
Create Feature Matrix - a consolidated view of your product features across your app or business. Its main objective is to document and track your value offering to your user base. You need this Matrix to set a baseline for the volume of user traffic for your analysis:
Create a Feature Catalog or Taxonomy - a detailed feature breakdown via user actions and attributes. It's a mapping of events, transactions, sessions, clicks, and hovers to the appropriate feature grouping. Check some of the examples here.
Create events for product features - depending on how your analytics are set up, you can create custom events or use grouping in Amplitude.
Set the baseline for active usage for each feature. Since not all MAUs have equal access to all the features, you should start by setting the expected baseline of users who can access a particular feature.
After defining your baselines, it’s important to identify transitional or gateway features. These features naturally have high usage and retention but may not necessarily offer the same value as smaller sub-features. In Amplitude, you can use Journey maps and access_point or entry_point properties to achieve this.
Exclude features from your analysis that don’t require proactive user engagement, such as ML-based recommenders, notifications, in-app screen mode (e.g., dark-screen mode), or no-ads experience.
Use product metrics that indicate both the frequency and depth of user engagement. I look at what % of total MAUs have access to the feature, then what % of users actually choose to interact with it (AVG DAU), how often (DAU/MAU ratio), how much (Total usage, AVG per user), and how many users are likely to come back (Retention(Day 7), and Retention(Day 30)).
To learn more about how to make sense of product metrics, see examples, and walk through the steps of feature analysis in Amplitude, read a full publication - The Ultimate Guide To Product Feature Analysis.
Big thank you to Paul Levchuk, Stu Kim-Brown, Sonia Wong, Timo Dechau, MyFitnessPal, Strava, and Amplitude teams for their valuable feedback on a draft of this post!
Thanks for reading, everyone. Until next Wednesday!


another follow-up: how can you determine what's "good" for your product or not haha it seems like one of best applications of this type of analysis might help you prioritize your investment into product areas? thinking out loud here haha because obviously strava logging runs is going to be the top used feature but is 3 days enough or 4 days, etc
love it! think the hardest thing in Amplitude or similar is finding ways to "reduce noise" so some of those charts (eng matrix or pathfinder) are useful...that's why for some of these posts, i'm tempted to just revert back to google sheets or even some sort of notebook haha
anyways, one quick question - specifically, when it comes to a freemium app..let's say Strava
how would you recommend putting this INTO action when it comes to understanding which premium features drive the most usage or growth?