When To Use Mean Or Median - Issue 171
Working with descriptive statistics: how to know when to use Mean or Median in your reporting
Today’s publication is a continuation of my Statistics series:
What Statistics Are Used In Data Analysis? - An introduction to the top four statistical concepts we apply and rely on in analytics.
Statistics 101: When Simple Becomes Tricky - Descriptive statistics basics (and a reminder of how easily simple mistakes can slip in.)
Applying Statistics In Product Analytics - A deep dive into distributions, their types, and use cases.
Now that you know that most of the analytical world is built on distributions, I will walk you through the cases and examples when it’s acceptable to use Mean vs Median and when it’s okay to use both.
Central Tendency Theory recap
If you skipped statistics back in school
There is a lot written out there on the Central Tendency. Here is what you need to know when working with descriptive statistics:
Central Tendency is a theory about the center of the data set. Why is it important? Because once you locate the center of the dataset, then you can describe it, graph it, and model it. If your center is off or incorrectly defined (e.g., using the flawed Mean), your whole distribution will be off, leading to the wrong outputs affecting your analysis, model, A/B test, etc. In statistics, the truth (and confidence) starts with the center.
Mean, Mode, and Median are the top 3 measures of Central Tendency.
There are more Central Tendency measures (e.g., weighted average, geometric average, midrange, trimean, root mean square, simplicial depth, etc.). For analytics, most of your work will be around the top 3: Mean, Mode, and Median.
You would use the top 3 to (a) describe the dataset (hence why, it’s called “descriptive” statistics) and (b) locate the center of the dataset.
Once you know the center in the dataset, you can locate the dataset ranges, variance, and spread.
Median vs Mean
Choosing Mean vs. Median mostly depends on two factors:
The data type you work with and
The data distribution.
When you can use both Mean and Median:
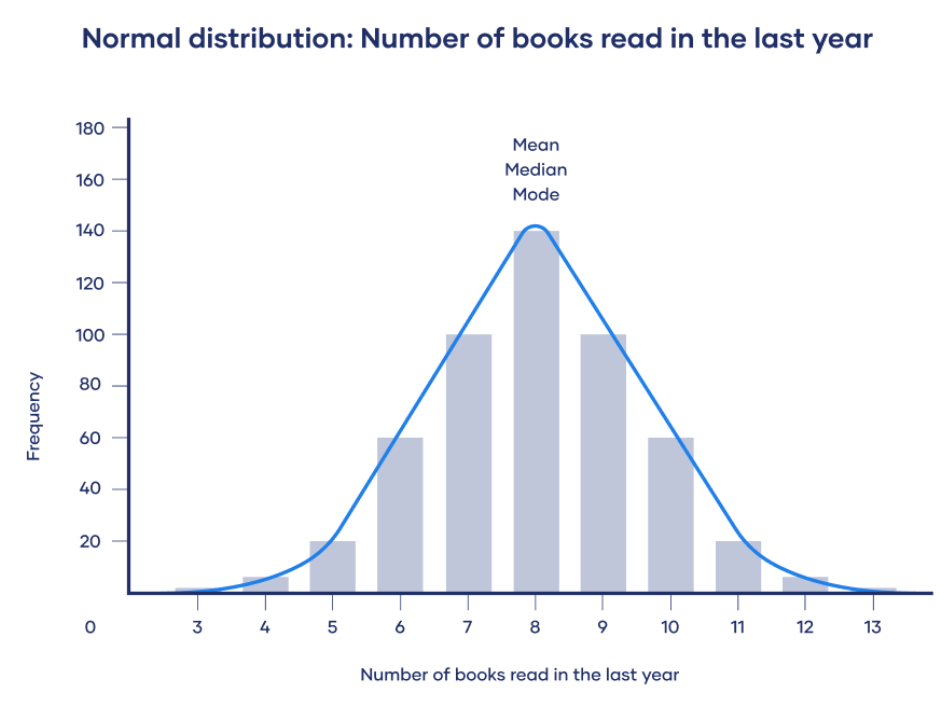
When data is normally distributed (or close to normal distribution), the values are evenly distributed around a central value.
When the data is symmetrically distributed.
When the data is continuous or discrete:
Discrete: (1, 2, 3, 4…)
Continuous: (1.1, 2.45, 3.543…), 26.5%, 30C, 65F, 12.3 miles, 2.5 hours, 10/3/2023…
As you already know, the Mean is the most commonly used summary statistic. It is essentially a mini model of your data set.


