
Where To Build That Metric
A framework for developing business metrics - a guest post by David Krakov, co-founder of Honeydew.


Welcome to the Data Analysis Journal, a weekly newsletter about data science and analytics.
Data and analytics are going through a massive wave of tooling that is rapidly accelerating. You will likely fall behind unless you read a hundred newsletters, watch webinars every other day, and attend data workshops. And, if you do all those things, you are likely overwhelmed.
What is the right way to set up your reporting today?
Should you use semantic layers?
Do you need dbt?
Which data setup best supports a hundred metric dimensions?
Should you prioritize reporting flexibility or consistency?
Changing reporting setups is both costly and time-consuming, so it’s important to get it right. To help us figure it out, I invited David Krakov, who has been building data products for the last 20 years, to share his insights on how and where to build metrics. David is a second-time founder (his previous startup was acquired by Starburst, a data lake analytics platform) and the co-founder of the YC-backed and Snowflake Startup Challenge finalist Honeydew, the semantic layer native to Snowflake that helps standardize metrics, reduce their analytics engineering efforts, and eliminate duplicate logic.
In this publication, David discusses various strategies for automating metrics, ranging from ETL/ELT and BI to leveraging a semantic layer, and highlights the specific scenarios where each approach proves most effective.
Where To Build That Metric

For a user, a metric is a number they care about in their favorite dashboard or tool.
For its maintainer, a metric is something to worry about: maintain its consistency across use cases, ensure it is up to date, enable debuggability to understand a change, and allow reusability for downstream logic. A misplaced implementation can lead to duplication, data errors, and frustrated users.
Have it wrong, and your awkward conversations/month metric starts to grow.
An awkward conversation starts with a number that looks silly. “Why did it change?”, “Why didn’t it change?”, “Why does my dashboard say differently?”, “I know this is wrong”, “How did you say you counted it?”, “What did you do?”
The good awkward conversations find the culprit in something that changed in the business. The common ones find a bug in a query or some Tableau being out of sync. And in the bad ones, the messenger gets shot.
In every data stack, there are at least four different places where a metric can be built:
During ingestion (in ETL or a data transformation tool).
In the data warehouse (in ELT, using a tool like dbt).
In the BI tool (like Looker, Tableau, or PowerBI).
In a standalone semantic layer (like Metricflow, Cube, or Honeydew).
Each one is a compromise between reusability, consistency, and performance. Good compromises keep awkward conversations low, and business value high.
This post aims to provide analysts with a framework for determining the optimal method to build a business metric.
What is, technically, a metric?
For a small side quest, it is useful to define what a metric actually is. One way to skip the quest and head straight to the “Where do I build it” section is to think of a metric as “a count query that users want to run.” That’s what it is!
However, one important thing to remember is that regardless of where the metric is built, it should have every technical property. I tend to think of this as a mental checklist: You’ve got a query to run. Did you bring all the parts with you?
Aggregation Logic
Every metric applies some aggregation to the data:
The simplest ones are just a function call: be it your basic
SUM(revenue)andCOUNT(DISTINCT user_id)or a fancy approximate count.Filtered metrics combine a filter (segmentation of the data) - for example, the sum of revenue in the midwest or the active user count.
Growth metrics (YoY, MoM) can combine the same metric at different times (i.e., value this month and value last month).
Contribution metrics (per-location sales as a percentage of total sales) can combine the same metric at different levels of detail (i.e., per location and total).
Aggregation granularity
Metrics are always counted on a specific level of granularity:
Average session length is counted at a session granularity (a row for a session).
Revenue might be counted at payments granularity (a row for each line item).
The first activity date might be counted at user events granularity.
Data source
Which tables are powering the metrics, and how they are joined and built:
The per-session data might come from a single
sessionstable.Transaction data might require
LEFT JOINanorder_itemstable withordersandcustomersto compute the revenue metric.The first activity date might be based on extracting a
datekey from a JSONevent_user_datacolumn in the events tables.
Time Grains
Most (but not all) metrics operate on time. How they do it is important:
An MoM growth metric might be only computable between EOM (month-ends).
MAU might calculated differently than DAU.
Total sales might be available per month/quarter/year but not per day due to backfills and end-of-month processing.
Dimensions
Which dimensions can be used to slice and dice the metric by the user:
Can an average web session length be broken down by user birth location?
Having all data available does not mean every metric can be broken down by every dimension.
Where to build it?
Build it during ingestion
Metrics can be computed during ingestion, i.e., by updating a count whenever processing a new incoming event.
Why:
Huge data amounts: When raw data is large and fast, computing metrics during ingestion is cheaper. If the raw data is unimportant (except for anomalies), it can even be discarded after a while. IoT-related data is a common example.
Low latency: When a metric must always be up to date to right now, then it must be continuously updated. For example, real-time metrics such as “visitors in the last 5 minutes”.
Why not:
Engineering process: Code that deals with ingestion is typically managed by data engineering or even R&D teams. Changes require coordination and carry an implementation cost. This makes it less suitable for dynamic business metrics or ones that analysts want to control.
Dealing with late-arriving data and backfills: Updating an already computed metric is much harder when data arrives out of order.
Specialized tech: Typically done with streaming data processors, in-memory databases, and other tools that are definitely not an analytics-friendly data warehouse.
No raw data: It might be harder to connect the raw granular data that served the computation of a metric with its computed value during data ingestion to debug or deep dive.
Build it in ELT
Metrics can be computed on granular data after it lands in a data warehouse. There are different approaches to accomplishing this: one way is by building a transformation flow using a tool such as Airbyte or Fivetran; alternatively, by building queries as dbt models and utilizing an orchestrator like Airflow:

In a bare-bones data warehouse without ELT tooling, even a VIEW can be considered a type of ELT (especially once you find more VIEWs stacked on top of it).
Why:
Consistency: A metric consumed from an aggregated VIEW or TABLE is guaranteed to be the same in every tool that uses it.
Debuggability: The source code for the metric is an SQL query, which makes it easier to debug and understand.
Centralized Governance: having a few places to define it (the source of a VIEW or a dbt model) makes it easier to maintain a governed source of truth.
Why not:
Non-aggregative metrics: Every new combination of dimensions or filters requires building a new ELT query, leading to code duplication, data errors when different models compute it differently, and spaghettified code bases.
Unpredictable downstream impact: When the metric ends in a table, it is hard to know who relies on that table afterward. Changing a definition can silently break assumptions in 500 dashboards.
Domain experts ≠ analytic engineers: When metric logic owners rely on analytics engineers to build ELT (due to skill set or access gaps), the added communication and implementation overhead creates conflicts and friction.
Many derived metrics: Derived metrics (for example, metrics that are built from others, i.e., contribution metrics, growth metrics, filtered metrics) complicate matters. With ELT, the initial choice of dimensions and filters is replicated for every derived metric, limiting flexibility. Different requirements for derivative metrics also result in duplication and model mess.
Build it in the consumption tool

Metrics can be defined at the final destination - the consumption tool.
This can be a data source for a BI, such as in LookML code for a Looker dashboard or in DAX for PowerBI, or Python or R in a Jupyter Notebook, or simply in a SQL query residing in a wiki page intended to be copied and consumed from a SQL IDE.
Why:
Flexibility for the user: A metric in a BI tool is flexible for any BI operations, such as applying filters or groupings, or can be used to build derivative calculations.
“Native” to the user: Metris in BI tools can support BI-specific implementations, including custom formatting, making them more intuitive for users.
Non-additive metrics: A metric is computed only when a user requests it, enabling the construction of complex non-additive metrics without compromising flexibility.
Why not:
Many consumption tools: Embedding code in one BI tool will get duplicated and reimplemented in every other tool. For example, a metric in a Tableau dashboard may also be needed for a predictive analysis in Python. Duplication across different tools almost always results in data conflicts.
Governance: Many BI tools lack version control or a formal deployment process.
Performance: Live queries from a BI tool can be much slower and costlier compared to querying precomputed metrics before reaching the BI tool.
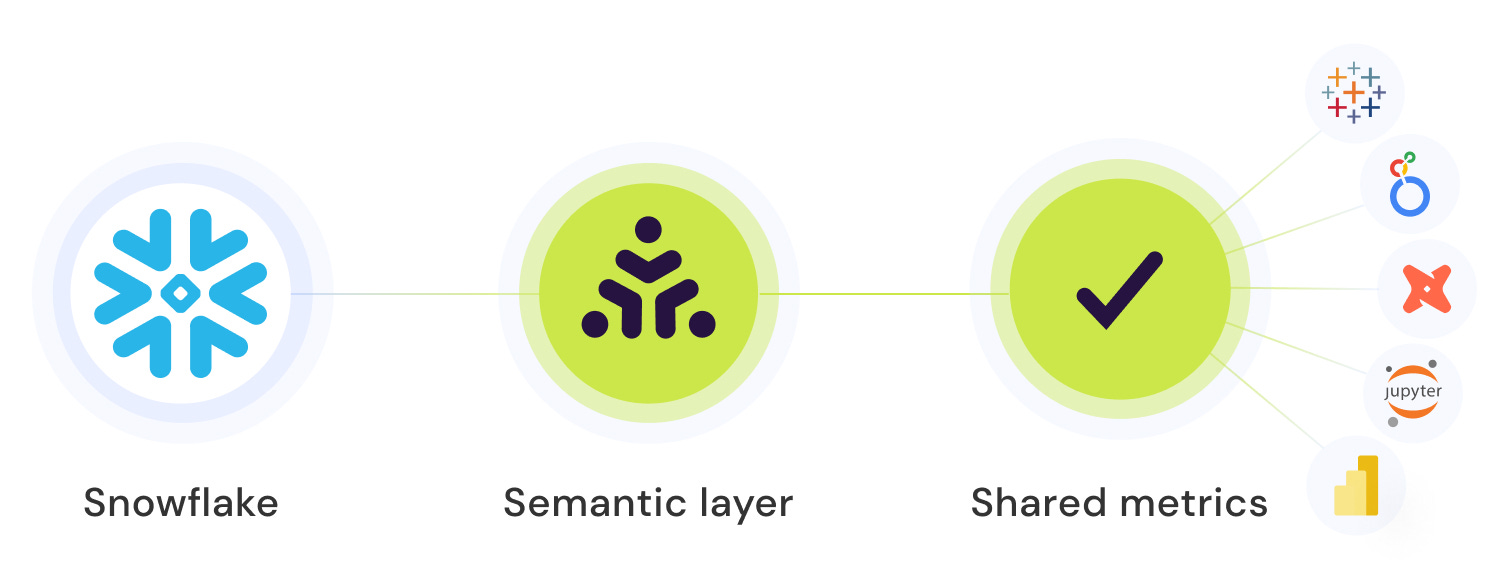
Build it in a Semantic Layer
A semantic layer or a metric store is a new concept: it involves separating the layer of metric logic from both BI and ELT processes. This is to get, on the one hand, the centralization and governance benefits of ELT and the flexibility and user convenience benefits of BI.
(Bias alert: I am a founder of Honeydew, the semantic layer for Snowflake. Other semantic layers exist, such as Metricflow, Cube, and AtScale).
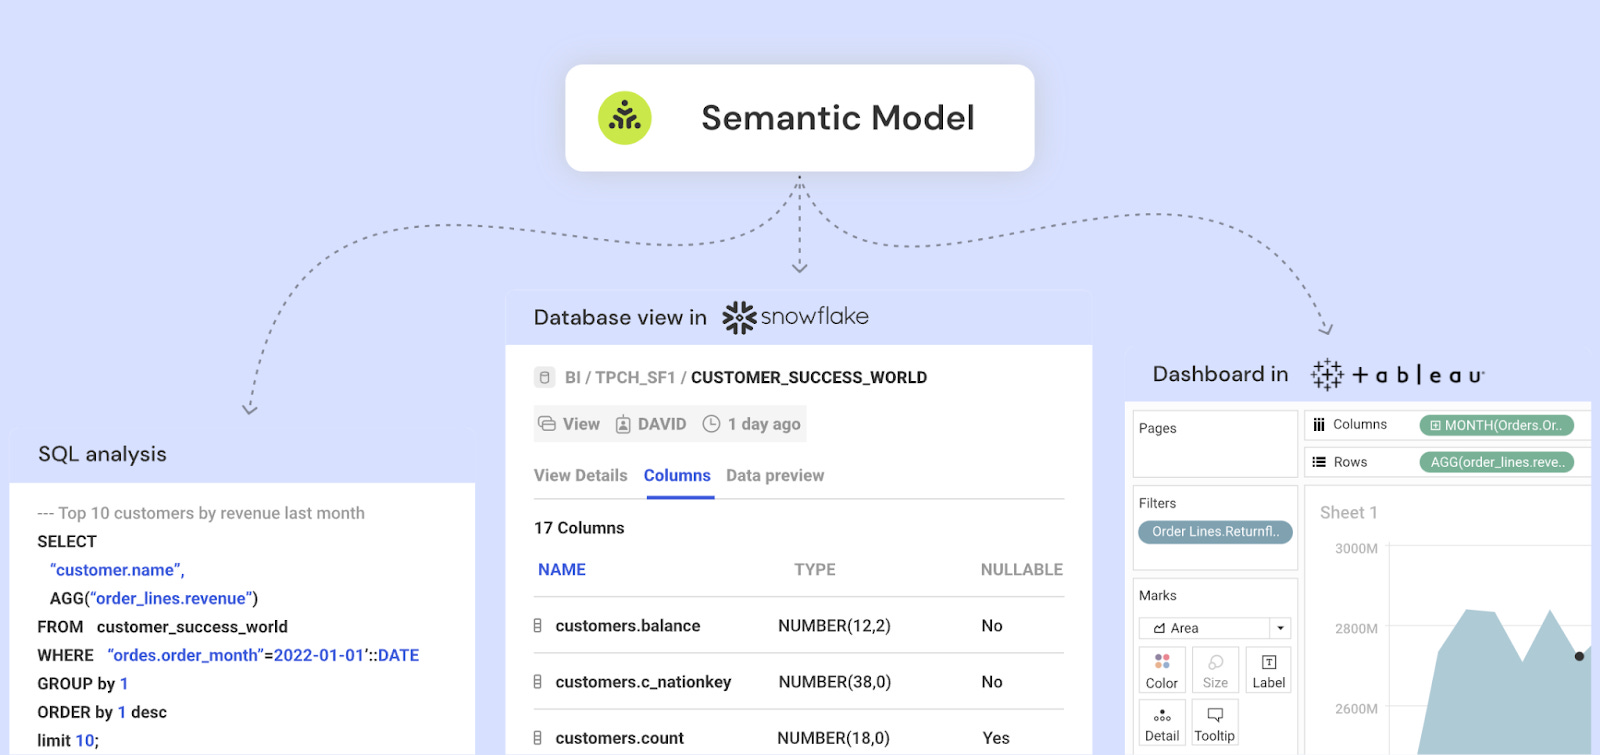
The way a semantic layer operates is as a tier between a user tool and the data. A user asks for a metric (”total sales by product in March”) using their tool. The semantic layer translates that request to a query that uses the standard definitions of “total sales,” “product,” and “month.”
Why:
Centralized governance for metrics: Metrics can be treated as “first-class citizens,” making it easy to standardize their definitions and reuse them.
No need to compromise between flexibility and consistency: Users can freely work with metrics (apply filters, slice them) in their tools. Each usage across all tools is powered by the same single definition in a semantic layer.
Derived metrics: Semantic or metric layers excel at simplifying complexity. Have a gross profit metric that is “revenue - cost”? It's a simple expression written once.
Distributing ownership: Semantic layers help bridge the gap between business analysts and analytics engineering.
Why not:
More moving parts: Introducing a semantic layer adds another component to the data stack. While it shines in handling complexity, in simpler data flows, it can become just another tool to manage.
Wild semantics: Semantic layers are typically more rigid than writing queries. They force at least some degree of design to data flows (how much varies between semantic layers). While this can promote the health of the data stack and practitioners, not every data architecture is compatible.
Sometimes, performance: Semantic layers significantly vary in their approaches to performance optimization. Depending on the use case, they may be slower (or faster!) than traditional ELT or BI logic implementations.
In conclusion

Do not worry, it’s only a half-year project to build it again.
Thanks, David!
Learn more about Honeydew - https://honeydew.ai/product/
Thanks for reading, everyone!
 | A guest post by
|