
Why You Shouldn’t Stop A/B Tests Early - Issue 193
Why significance matters, and how long you should run an A/B test

Welcome to the Data Analysis Journal, a weekly newsletter about data science and analytics.
Today, I wanted to cover the most commonly asked questions on experimentation in analytics:
How long should you run an A/B test? It’s recommended for 2 weeks, but why?
Can you (or should you) stop an A/B test early?
If you have to, what is the safest approach to handling fast A/B tests?
Why are slow rollouts dangerous?
What is the recommended procedure for gradually launching A/B tests over time?
There's a wealth of information on A/B testing available, ranging from academic papers on the frequentist approach (which is often less relevant for marketing or product analytics) to complex probability theories. Today, many product and analytics leaders may not have a background in statistics. Their knowledge of A/B testing often comes from online courses and self-study. As a result, they might not grasp the differences between A/B testing and Hypothesis testing or A/B testing and Split testing. This can lead to applying the same strategies to each or, even worse, having the same expectations for data trust in their results.
“A Bayesian is one who, vaguely expecting a horse, and catching a glimpse of a donkey, strongly believes he has seen a mule.” Dr. Rob Balon.
While I can't reinvent statistical methods to make Bayesian analysis fit the Frequentist framework, preventing stakeholders from being offended when analysts admit to having low trust in data (breaking news: most winning A/B Test results are illusory), I can at least re-iterate and clarify the basics here.
Why significance matters
Because early experimental data is more likely to be wrong.
You shouldn’t stop the test early - even if you think you see a clear winner - because of regression to the mean.
Regression to the mean (RTM) theory describes the false-positive result. It’s an effect when a variable is extreme at first but then moves closer to the average. In real life, the RTM conversion looks approximately like this:
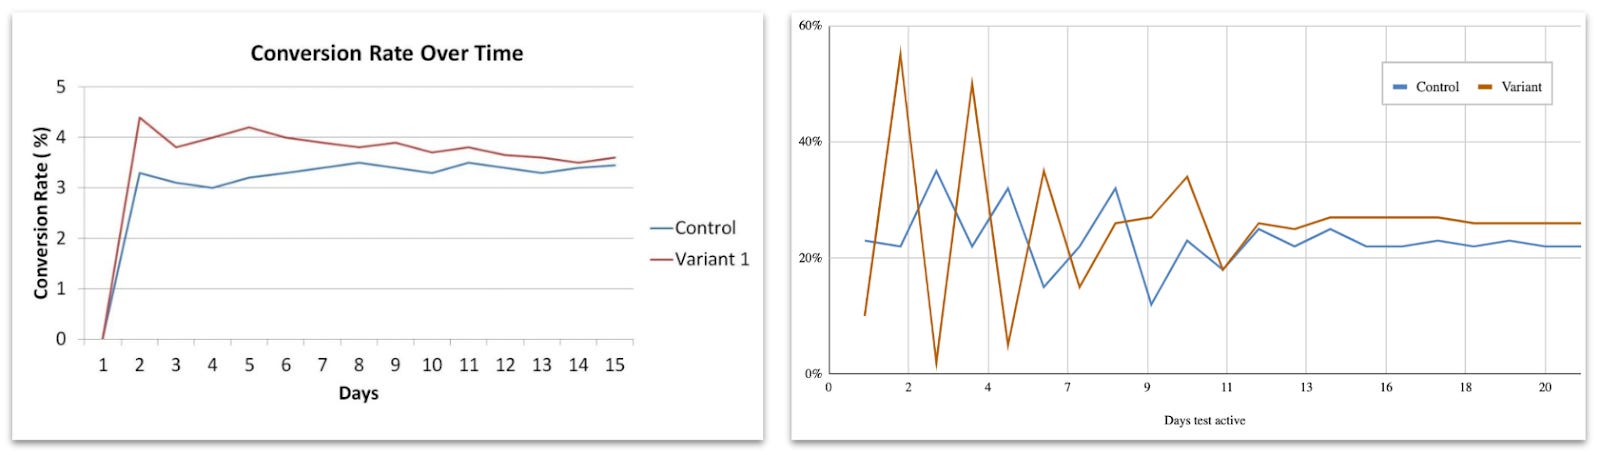
As you can see, the Variant conversion fluctuates significantly at first but then normalizes and begins getting closer to the mean.
In the examples above, Variant conversion changes a lot during the first 10-12 days and then stabilizes. The chart on the right is a more extreme example to illustrate how impactful and prolonged RTM can be. In my experience, I often see it stabilizing after around a week or so, eventually looking more like this:
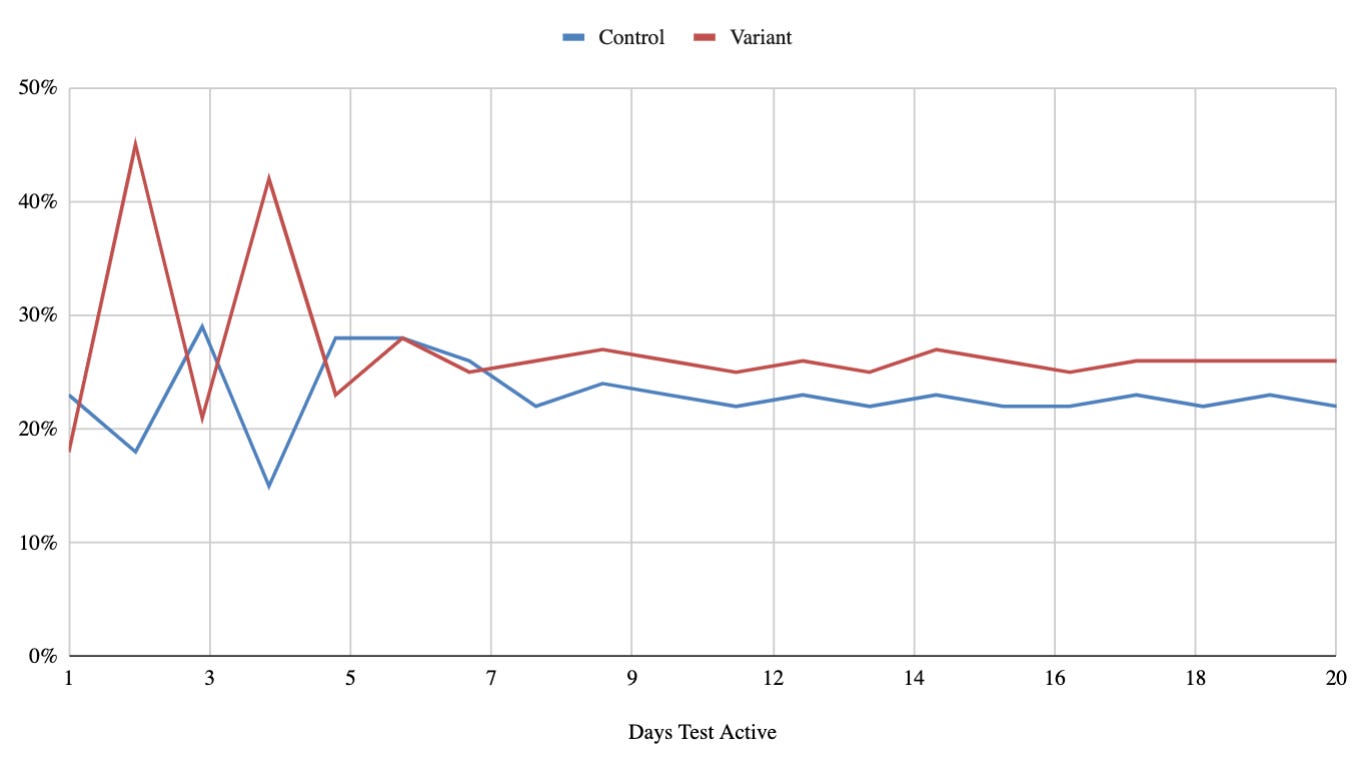
Depending on the daily sample volume, your test will show something else. Once you have completed a few tests, it becomes easier to identify the test stages relevant to only your product and tested traffic volume. These stages will guide you in estimating the test timeline to reach significance and decision-making, especially for the “fast” tests.
For the example above, for Bayesian tests, I segment 3 lifecycle stages:
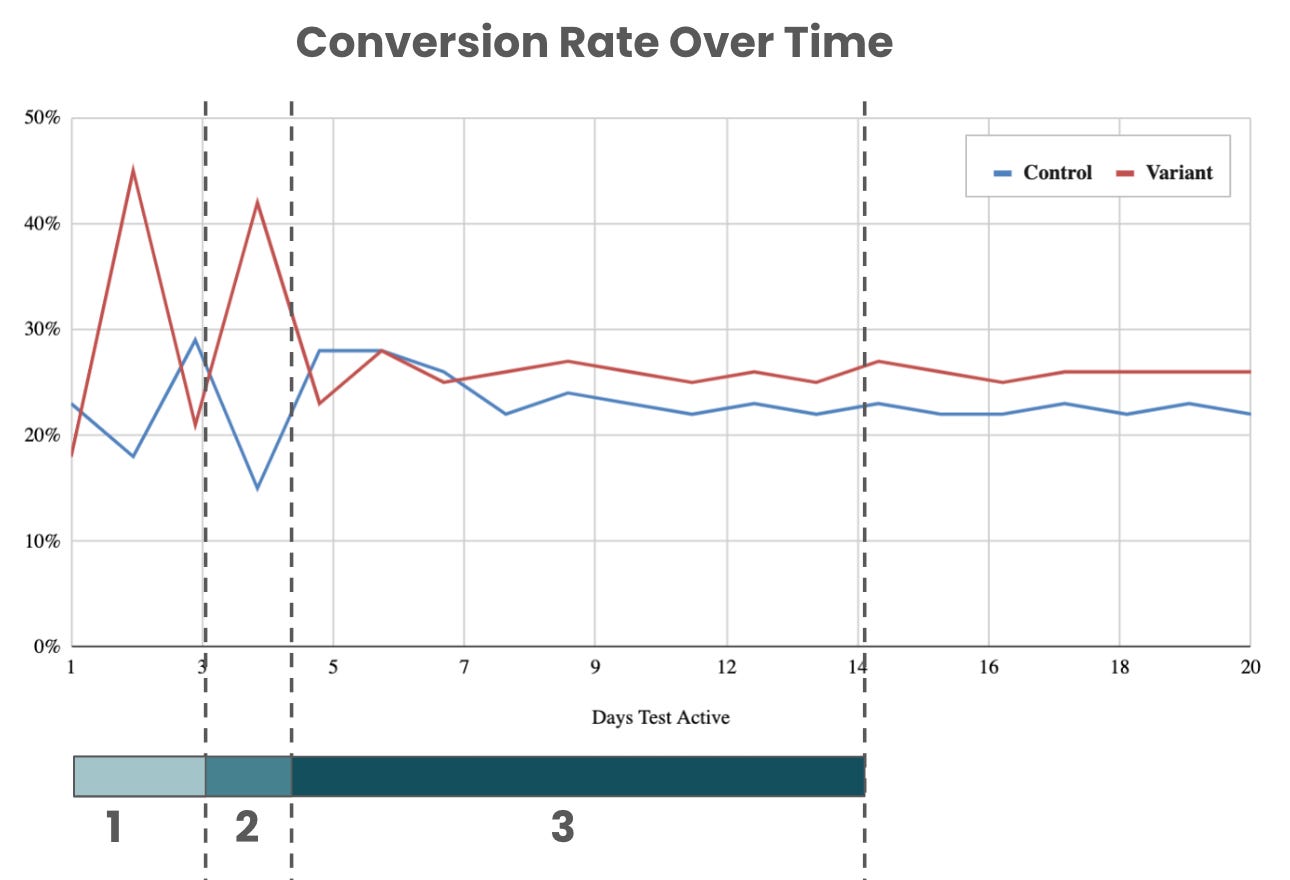
The first stage can be from a few hours to a few days and serves as a validation step. This is the time when you pick random users and check their attributes, distribution, tenure, etc.
The second stage is vital and is usually short (often just a day or two). It is a turning point for estimating significance. (It doesn’t mean the data is significant. But at this stage, for analysts, it’s usually easy to confirm how long the test will be running).
The third stage is the longest and the most stable. The test is getting confidence during these days. Your conversions are not expected to move significantly afterward.
In your analysis, you treat these stages differently. Changing test traffic volume or setup during the first or the second stage is dangerous because you are likely to run into strong RTM. That being said, making test alterations during the third stage can be a compromise, which would be to move faster but at the cost of a lower degree of confidence.
Other definitions of RTM I run into are “random measurement error” or “non-systemic fluctuations around the true mean”. RTM is quite tricky and makes the test data you receive look like a meaningful result (when it isn’t!). It becomes even more concerning when you accept it as a true test outcome and then run other tests against this “winning” group. And now you’ve ended up with multiple flawed tests (which is exactly what split tests do).
Why does RTM occur?
To simplify, you are likely to run into this effect when:
Your samples are not randomly distributed.
You are at the mercy of your experimentation instrumentation tooling. If it doesn’t do a great job of randomly disseminating users (which is often tricky to validate), there isn’t much you can realistically do except lessen your trust in your A/B tests.
Multiple rollout stages, sample size, or variance change.
These are the slow rollouts. Let’s say you launch Control and 2 Variants to 25% traffic with a new 34/33/33 split. After a few days, you remove Variant 2 and launch Control and 1 Variant with a 50/50 split to 50% traffic. You are way more likely to end up with a high probability of RTM.
Your target audience has too many properties.
The more attributes your target audience has, the higher the opportunity is for RTM. For example, to be qualified for the test, your users have to be in a particular country, use a specific language, be paid subscribers or complete at least 4 transactions, are eligible for a trial or a promo, and have particular settings enabled on their profile, or else. All of these are user attributes that qualify them to receive a test experience. The fewer attributes you apply, the cleaner (and faster) your test will ultimately go.
How to prevent RTM?
In truth, there is nothing you can do to eliminate the effect, but you can reduce the probability that it will affect your test. Here are some basic common protection practices:
Before any experimentation, know your expected conversion (baseline). Ideally, measure it multiple times, know its range, and compare averages. This will help you identify if your Variant conversion is way off or suspiciously high or low. Don’t trust Control as your true Baseline.
Avoid running experiments on complex user groups that have many properties. The more attributes you introduce, the more complex the experiment becomes.
The test groups should be randomized and normally distributed (avoid mixing new and existing users).
Avoid slow and disproportional rollouts. For example, once the test has been released to 10% traffic, do not reduce its size.
Don’t stop the test earlier than planned, even if it appears you reached significance or you have a clear winner or loser.
If you have to finish the test ASAP and don’t trust the results, you can run the analysis of co-variance ANCOVA (ANOVA+regression). It used to be easy to run in SPSS, SAS, Stata, or other old-world statistical packages, but now you can also run in Python Pandas.
If you don’t have the resources or time to run ANOVA, here is my “rule of thumb,” which you’re welcome to borrow (with a degree of caution):
🟢 If variant conversion doesn’t fluctuate and stays the same throughout vital stages of the test, it’s likely trusted. You can end the test early, expand more traffic to it, and move on.
🟡 If variant conversion fluctuates during the early stage but stabilizes, you will likely be dealing with not normalized or randomly distributed samples. If this is a common effect, it means that your experimental instrumentation is not good. You can’t go fast with these tests. You have to run it long enough until you get significant data for a prolonged period. Lots of validations and checks are needed for such tests.
🔴 If variant conversion fluctuates during all stages of the test, and the significance is reached with a small difference from Control, you are likely dealing with an inconclusive test. Disregard its result and relaunch with a new audience or approach.
Hopefully, the early pattern you see stays the same or better and becomes more emerging throughout the test. Just don’t be careless with statistics and follow all the necessary steps and practices to ensure the testing effect you see doesn’t happen by chance (and remember, there is always a probability it does).
Learn more on RTM and test setup:
Thanks for reading, everyone. Until next Wednesday!
Nice article. In the graphs, how is the conversion for each day in experiment calculated ? Is it cumulative or only for users that were exposed on that particular day, I am asking because of the huge variation that then settles down ?