
Why Your Activation Analysis Is Wrong - And How to Fix It - Issue 247
How to locate and validate Activation using product analytics tools

Welcome to the Data Analysis Journal, a weekly newsletter about data science and analytics.
Before we begin, a few reminders:
Spring is coming, which means it’s time for data conferences, events, and meetups. With so much happening, I want to highlight a few upcoming events:
This week, Canada is hosting its largest data conference in Calgary - YYC Data Con 2025! I am partnering with DataCon this year, and while I won’t be able to attend, I have a few tickets to share with my readers. Let me know if you want to go.
Are you comfortable with Tableau or PowerBI? In that case, you still have time to participate in the visualization contest organized by the Global Organization for Analyst Transformations (GOAT), a career development community. This is your chance to create a strong portfolio, gain visibility, and be featured in the analytics community. Submissions are due by Friday, Feb 28th, 5:00 PST.
Join me on March 12 at Amplitude Office Hours in San Francisco. I will be there to help with formulas, metric building, or any Amplitude questions you have. Bring your laptop (or not), book an expert, and we will help you create the report you need. Hopefully.
A year ago, I shared my analysis on Activation I did at MyFitnessPal. Many apps reached out with questions about modeling, performing regression in product analytics tools, and handling tricky Activation cases.
So today, I want to follow up on Activation and show you how to identify a-ha moment, different ways to calculate it, and what to do when you’re not getting a clear signal or your data is inconclusive. I’ll also walk you through how to get Activation in product analytics tools and validate it through analysis.
If you’ve been reading any PLG-related content, you’re likely familiar with Activation or a-ha moment. I believe it initially gained popularity with Facebook’s famous “7 friends in 10 days” and was later revived with the PLG movement.
Today, I won’t be discussing the concept of Activation but rather how to calculate it using product analytics tools or modeling. If you are new to Activation, please start here:
Locating Activation milestone in product analytics tools:
Here’s what 90% of growth marketers do to locate Activation:
Create an onboarding funnel that tracks every onboarding step.
After the last step in the funnel, add one more step for the first successful key action users complete (e.g., create a report, listen to a song, log an exercise, etc.) and call it the Activation rate.
Set the funnel to 1, 4, or 7 days.
Done.
This is an incomplete and inaccurate activation funnel. However, it’s the best you can do using the Funnels feature in product analytics tools.
Then, analysts step in and create a cohort of returning users who completed the key action after returning within X days. We do this using Retention or Heatmap features - not the Funnels.
But this still isn’t Activation. It’s simply the % users performing the core action on a given day. It might indicate Activation - or it might not. And there is no way to definitively know unless you leverage Compass in Amplitude or Signal in Mixpanel. However, both come with data context and caveats. Let’s break it down.
Calculating Activation - Expectation vs. Reality
Expectation:
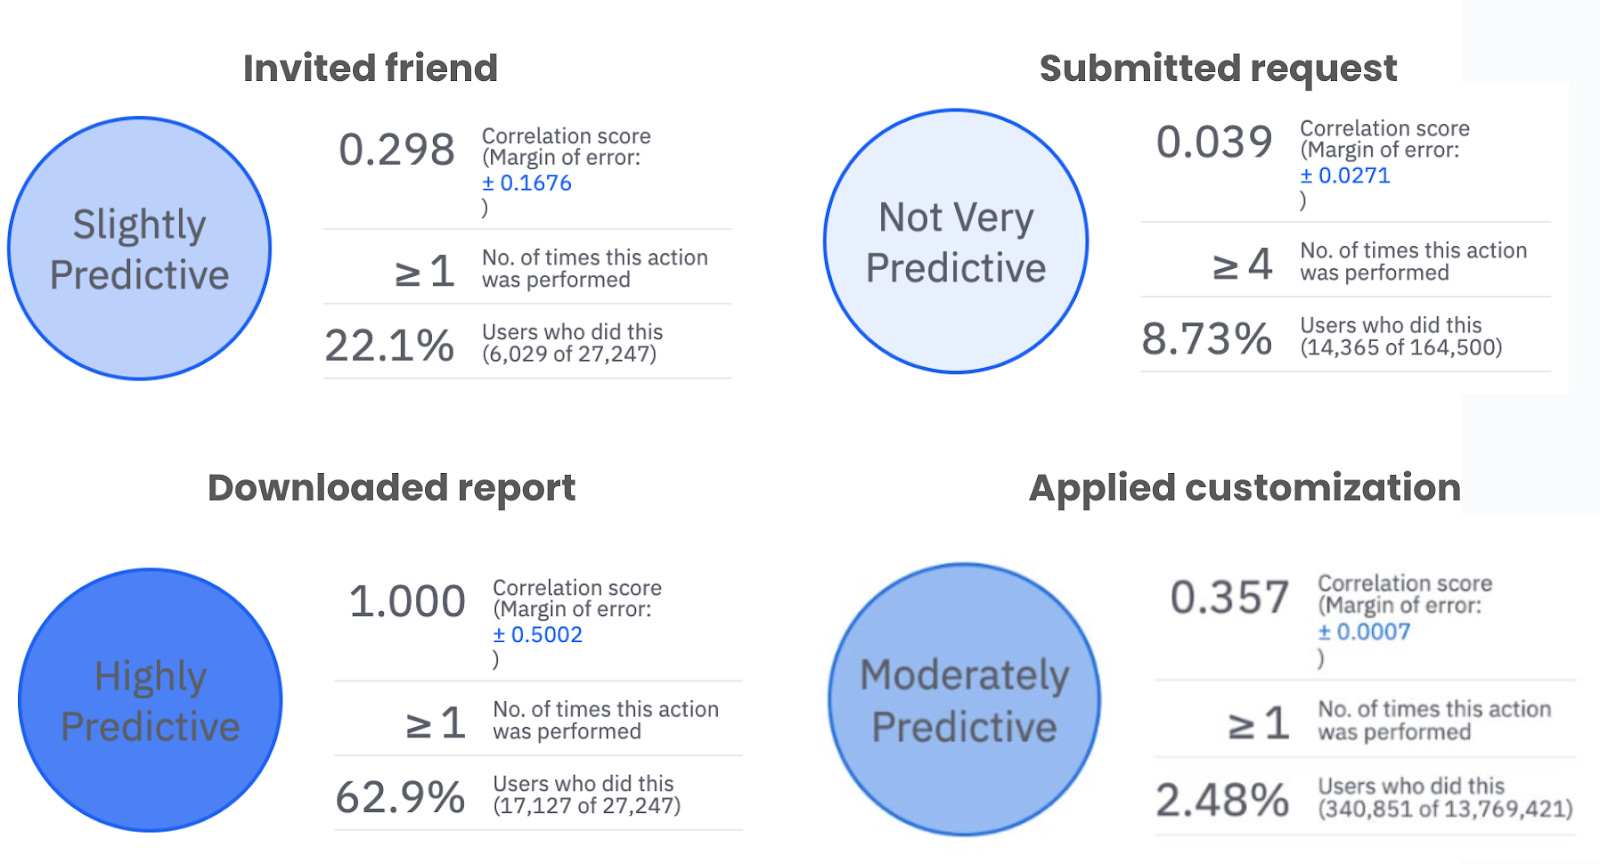
You open Amplitude and instantly see your Activation milestone clearly within seconds:
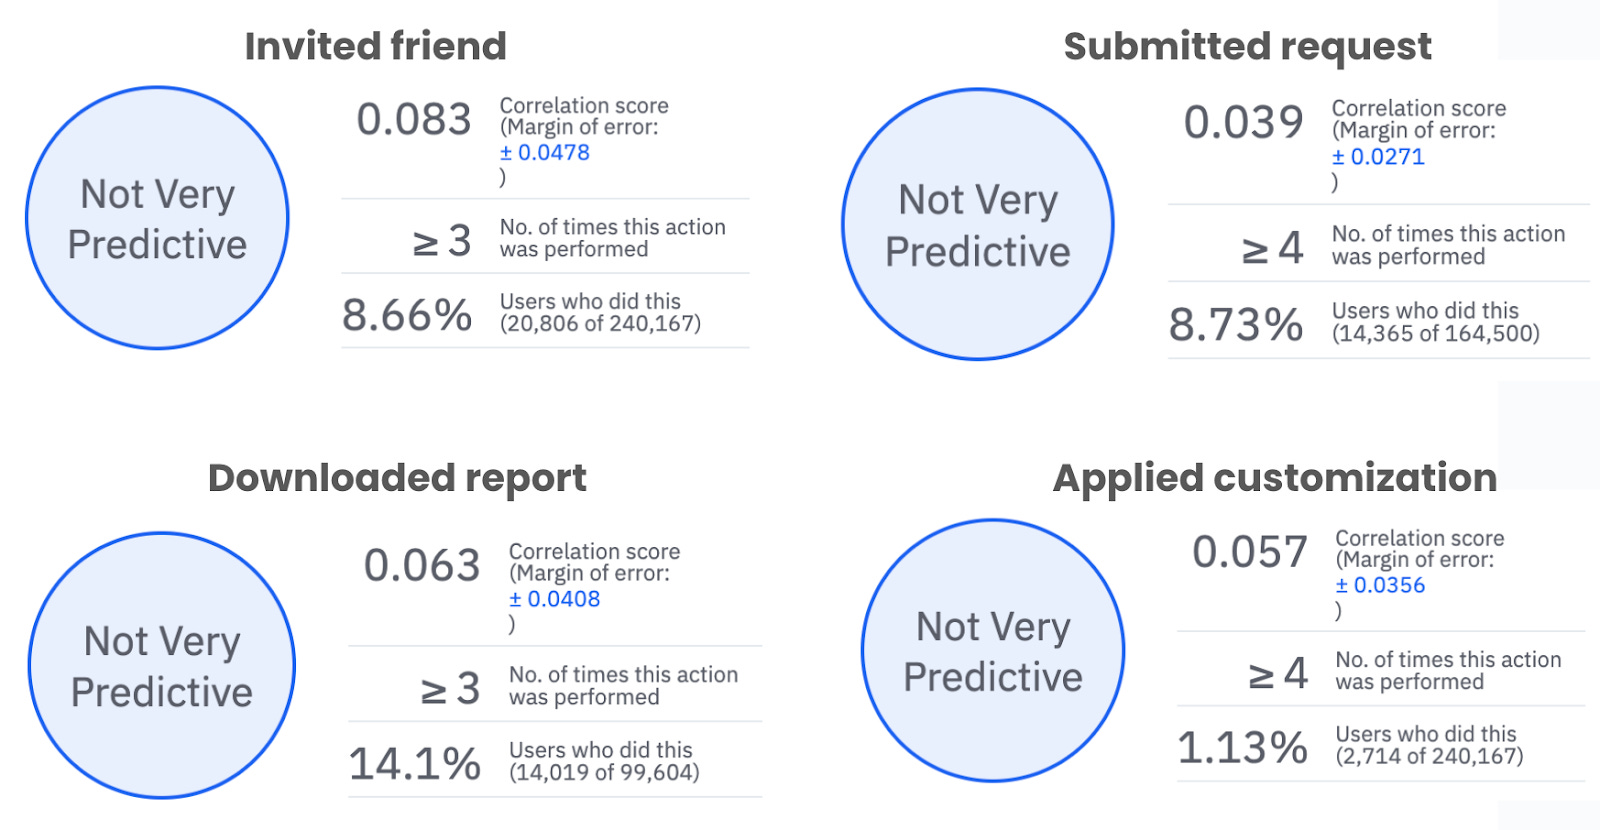
Reality:
Such analysis worked for MyFitnessPal because (a) I spent months setting up and fine-tuning analytics there - we had to reset events, remove noise, configure retention definition, and more, and (b) we had 10 years of data.
If your app was launched recently and your analytics weren’t set right, your Activation report is likely to be inconclusive.
It doesn’t mean your product doesn’t have an Activation moment. It just means you’re not capturing it correctly. The missing signal could be due to noise in event tracking, outliers skewing data, insufficient data, skewed distribution, or other data inconsistencies.
If this happens, follow the steps below to manually find your Activation milestone using product analytics tools. Whenever I feel lost in data or struggle to capture the signal, I use this framework - and it works every time.
