
How Data Analysis Can Save Lives - Issue 45
A recap of data analysis publications, news, and tutorials over the past month.

Hello analysts, and welcome to a free edition of the Data Analysis Journal! A newsletter about data analysis, data science, and business intelligence. If you’re not a paid subscriber, here’s what you missed this month:

May is the month of hope when you still believe that the low churn rate may catch up to meet the Q2 goals.
It’s the month of expectation for the upcoming wave of events, summits, and conferences coming for the summer.
May is also a month of one of the most important cultural events in the world because of my birthday 🎂. And to celebrate, I decided to make this newsletter a little special. Along with a recap of news, publications, and tutorials, today I wanted to share my favorite inspiring stories about how data analysis makes an impact and even saves lives. I hope it will inspire more readers to learn analytics, learn how to leverage data, and get empowered with data storytelling.
🔥 What’s new this month
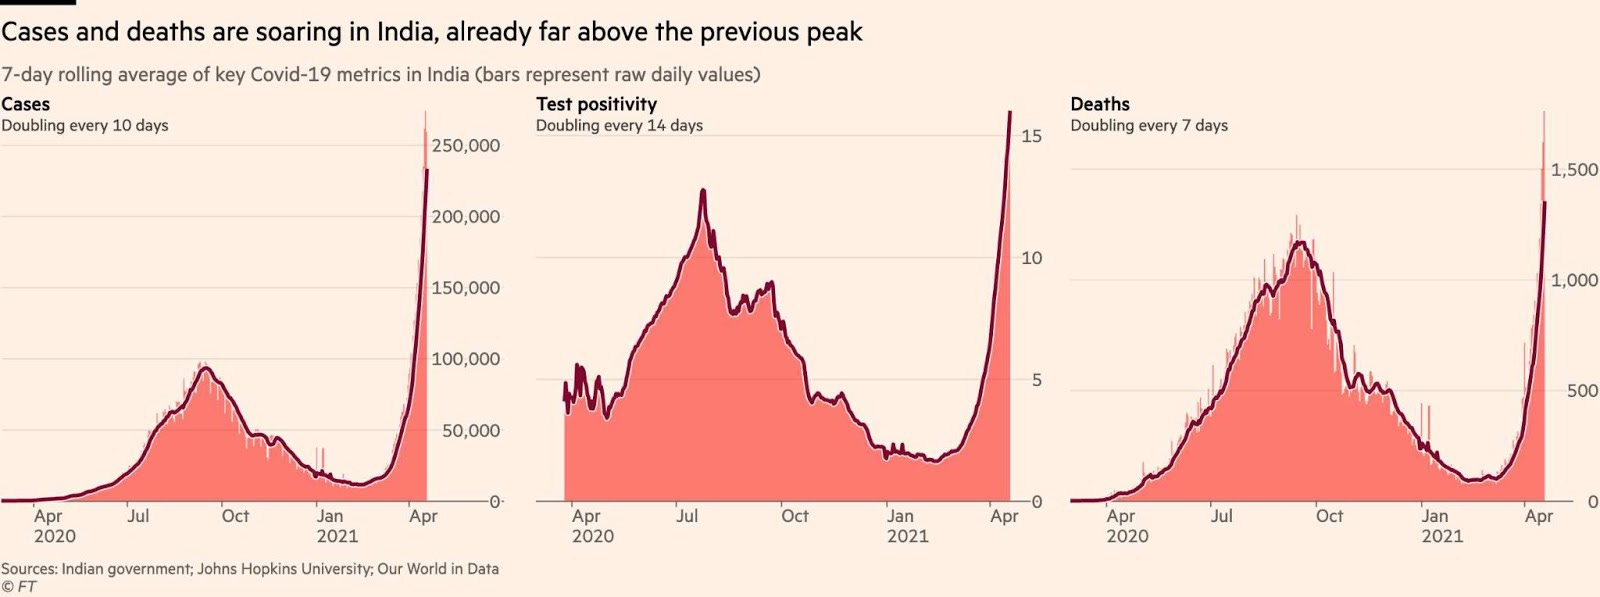
Covid news. In India, infections are still climbing faster than in any major country. Here is some data behind India’s devastating second wave:
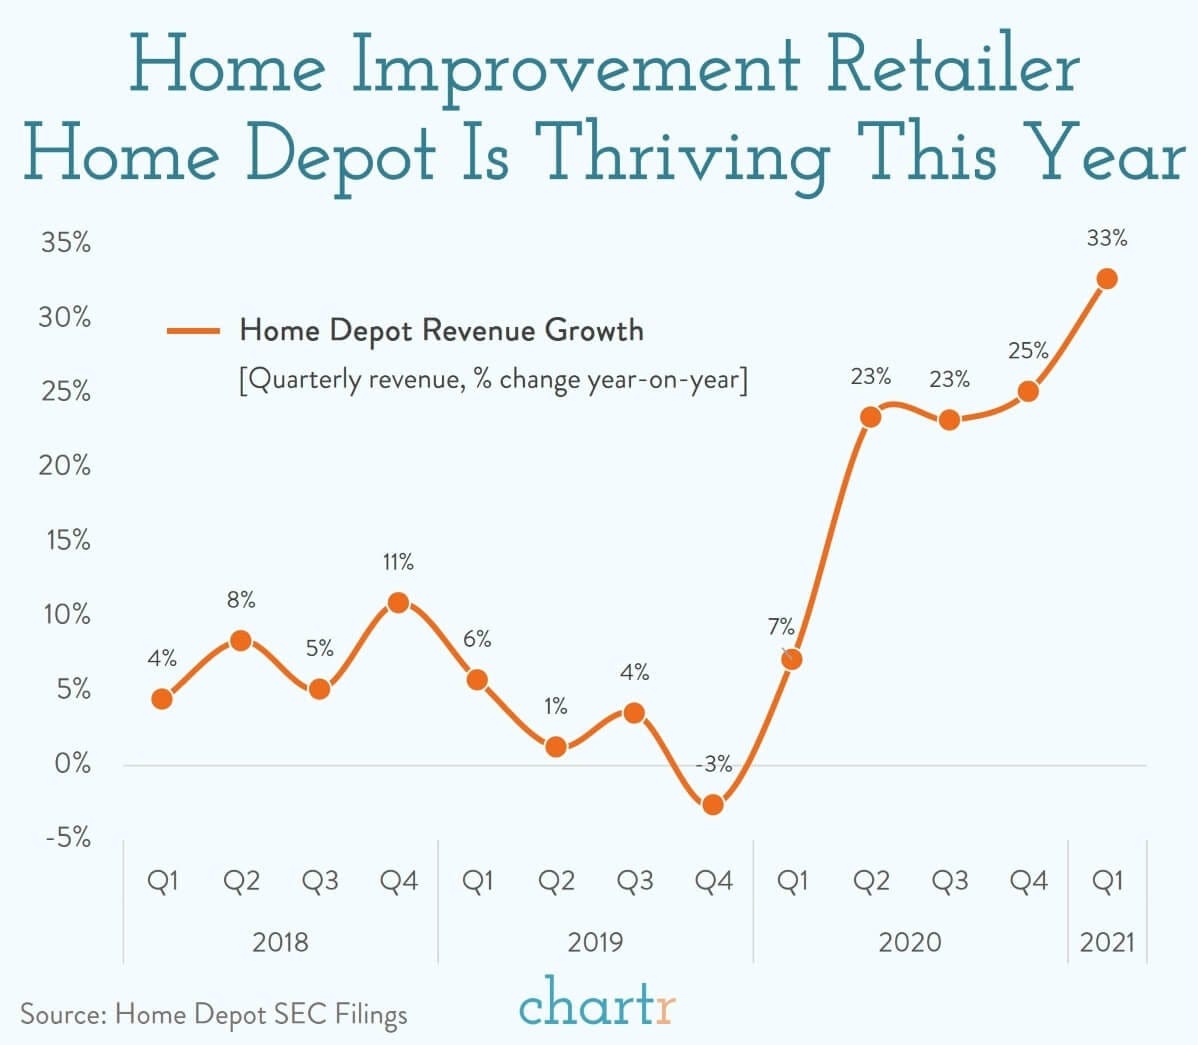
Home Depot reports 33% up revenue after the pandemic started. Interesting. I guess lockdown means time for home improvements. Reposted from Chartr:
Amplitude acquires Iteratively. From Amplitude: “With Iteratively and Amplitude, digital teams have a Digital Optimization System with the best-in-class data management capabilities to ensure any data they access is clean, trustworthy, and error-free.” I remember discovering Amplitude and being one of their first early customers back in 2013. Since then, every year they continue to grow faster. I like it more over Mixpanel or Heap for a variety of features. Good for them. I do take partial credit for their growth, of course, being an early user. Amplitude folks, you can send your thanks to me in the form of birthday cards.
SQL and Pandas. I am one of those people who think that applying SQL in Pandas is like connecting a wind turbine to a solar panel - complex and unnecessary. This guy proved me wrong with his extensive guide on running SQL in Pandas for data analysis.
Scholarship for women for the Data Science program. Magnimind Academy will offer a full scholarship that is worth up to $6K to support and promote women who are practicing, studying, or are interested in ML or DS. The next Full Stack Data Science program is going to start on May 29th. Apply for this scholarship here and good luck!
Large datasets in Python. A new step-by-step guide about how to process large datasets without running out of memory in Pandas and NumPy.
DS and ML newsletter. If you are looking for a newsletter dedicated to data science and AI, check out the Open Data Science blog. They have a good roundup of articles about Deep Learning, NLP, Statistics, and Research, including a few of my own publications.
⏪ A Rewind Of Last Month
Paid Subscription Articles You May Have Missed
How To Install A Database - Issue 42
Have you ever received a take-home assignment to write a SQL query to solve a problem? Did you break your brain over how to install a database, replicate a table with a sample of data (that is usually not provided) and test your SQL? I did. Back then when I was young and foolish. After many hours of figuring that out, in this guide, I share with you the logic and steps on how to install and replicate a database with a sample of data on your computer.
What Is Customer Acquisition Cost And How To Improve It - Issue 43
This issue was created as a result of my collaboration with a few Growth Marketing experts for another publication - What is Customer Acquisition Cost? Let’s say you are a data analyst supporting growth marketing initiatives and have to report which marketing campaign has made the biggest impact over the last few months. The most successful campaign should have the highest ROI and lead to increased LTV. Your first step is to understand the Customer Acquisition Cost (known as CAC). In this article, I go thorough breakdown of CAC to highlight why it is important to measure correctly and the ways to improve it.
Python Questions For A Data Analyst Interview - Issue 44
Technical interviews are stressful and time-consuming. I felt like preparing for technical screens specifically created for data analyst positions was more challenging, because most materials out there are focused on the engineering aspect of problem-solving that isn’t quite related to analysis. Python questions are different for data engineering, data scientist, or data analyst interviews. This issue is about common Python questions you are likely to encounter in your interview and a set of beginner Python challenges.
🏆 Power of Data Analysis
There are so many examples of data impact in every industry from pattern recognition and real-time alerts or EDA and to ML or AL. Below are two stories I wanted to share that deeply impacted me and feel personal, real, and empowering.
Parents of a young boy with epilepsy started writing a seizure diary with detailed activities throughout the day. The data they collected showed an interesting pattern that led to folic-acid rich, protein-heavy foods and seizure correlations. After studying the data and adjusting the diet, their son was seizure-free for a year.
Read the full story: How Data Saved My Child
A breast cancer survivor, Regina Barzilay, who is also a Professor in the Department of Electrical Engineering and Computer Science, was using her own data and NLP modeling to develop an algorithm for early breast cancer diagnosis that was tested at multiple hospitals around the world. It allows detecting cancer 2 or 3 years earlier. She was awarded the 1 Million AI Squirrel Prize.
If you want to get more involved in medical research and analysis, sign up for this series of events and workshops to learn about how new visualization technologies and data analysis influence and develop cancer research organized by the National Cancer Institute.
📈 Your Next Data Science Project
Free and Open Public Data Repositories.
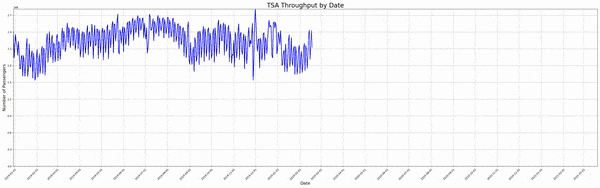
How many people are flying now? Work with the public dataset from the US Transportation Security Administration that indicates the number of people passing through its checkpoints, broken down by hour and location. You can grab either these structured data files or a published table of total “traveler throughput” for each day in 2021.
Spoiler alert:
🍸 Drink and Mingle
Upcoming free events, meetups, talks, and webinars.
May 24-28, DataBricks: Data + AI Summit 2021
May 27, WomenHack: WomenHack Virtual - recruiting event
May 27, Galvanize: CAREER TRANSITION: Geologist to Data Scientist
May 31, Galvanize: Intro to Python: Part 3
June 1, Virtual Data Science Learnathon
June 2, Product-Led Growth: Intro into Product-Led Growth
June 2, Galvanize: Intro to SQL and RDBMS
June 3, Amplitude: Digital Disruptors Summit
June 7, Galvanize: Intro to Pandas
June 9, Grid Dynamics: Data Points Summit


❤️ Giving back
To celebrate my birthday 🎂🎈, I am giving away 5 free 3-month paid subscriptions and 50% off an annual subscription to my readers.
Follow this link to subscribe: https://dataanalysis.substack.com/may_gift
Thanks for reading, everyone. Until next Wednesday!