
How To Get Average Logins Per User Per Day - Issue 143
SQL solution for getting average user activity per day for weekly or monthly reporting

Welcome to the Data Analysis Journal, a weekly newsletter about data science and analytics.
Today’s topic is another variation of engagement analysis we do to better understand user behavior.
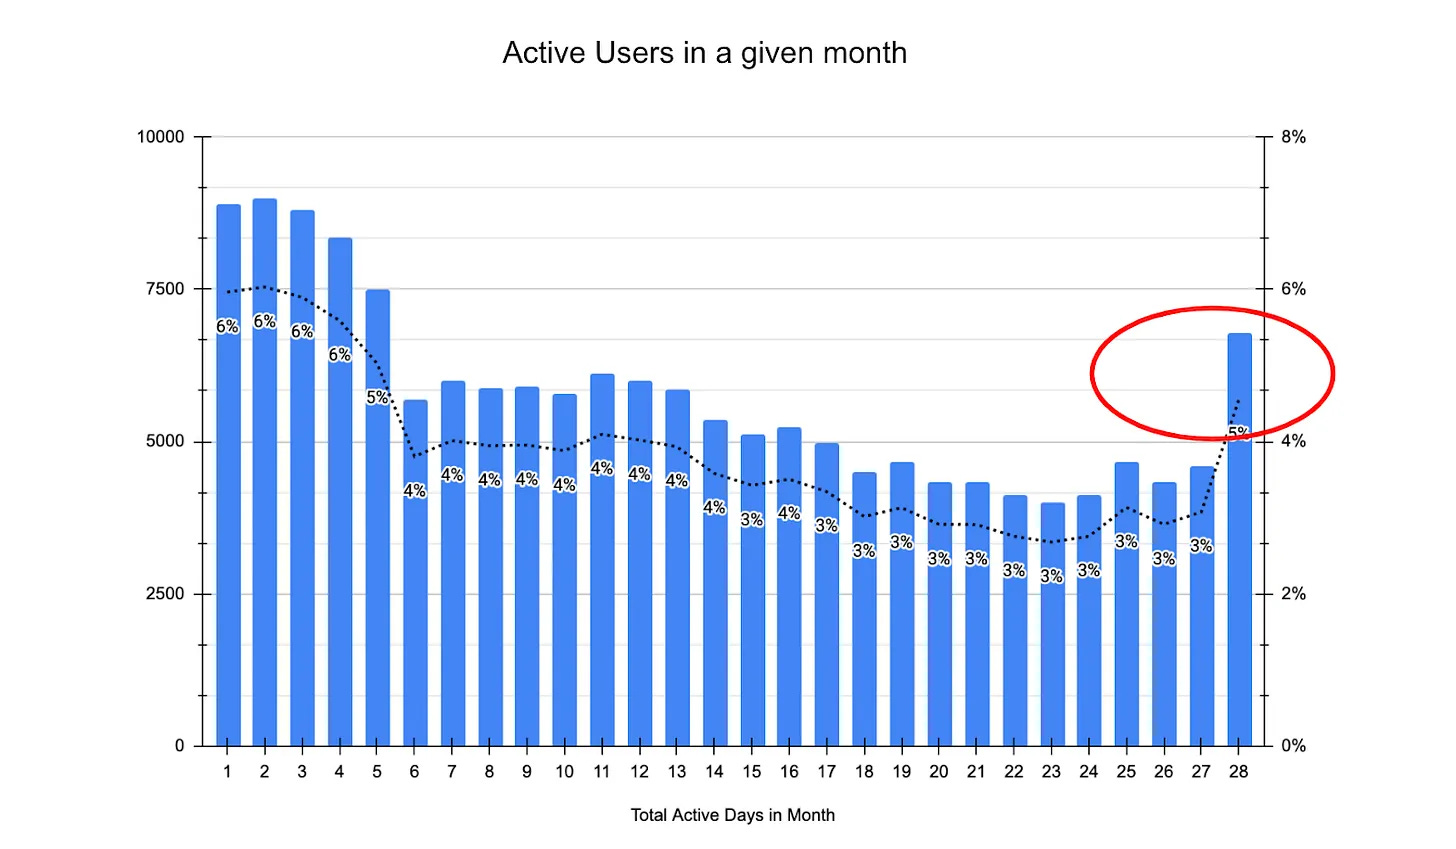
Earlier this year I shared The Frequency Of User Activity: SQL and Analysis which helps us uncover the frequency of usage and learn the total number of days users were active in a month. It also helps us locate power users, which we can pull into the cohort for email and other marketing campaigns:
Below, I’ll be going one step further and showing you a way how to get the average number of logins, actions, transactions, or likes per user per day to better understand the volume of user activity.
Let’s say that you started with the frequency of user activity analysis and confirmed that the majority of your core active users use your product daily. The next step is to deep dive into their daily usage to understand how many times users use the product per day, what the average daily usage is per week or per month, how it’s changing over time, and how it’s different across other platforms, locales, countries, or user segments.
Whenever I have to work with averages or medians, I prefer not to use product analytics tools, even though they make it very easy to get such stats there. My thinking:
Suspiciously high averages
In my experience, the averages I get with such tools are always significantly higher than they should be. I explain it via the tricky nature of events-based data and always validate metrics against server-side (hopefully) or 3rd party data. So it’s a no-go without SQL here.
Make sure to compare your high-level activity events against Firebase and Google Analytics, and check the expected volume with SensorTower data, Appfigures, Apple / Google store, or data.ai. Hopefully, you have a match in DAU and can rely on the median, mode, and averages for logins, app opens, transactions, clicks, and more.
Over-processed analytics
Some digital analytics tools often do extra work for you and remove outliers, re-distributing the population of users to show you a “cleaned” normalized average that is supposed to mean something they think you are likely to search for. For example, if you want to explore how many times per day users use your app, the system may hide extreme values like users who opened the app only once, or users who opened it more than 50 times, and return you only the average number that is relevant for the majority of your users. Instead, I’m more comfortable exploring outliers (if a segment of users uses your app 50 times per day, you’d better know what works for them so well), and then removing them myself (if needed).
This is especially important for reporting the average time it takes for users to complete a funnel, activation, onboarding flow, transactions, etc.
SQL for getting average logins per user per day
Task: get a monthly report of average logins per user per day, broken down by paid, trial, and free user type.
