

November Digest: A Whirlwind Of All Things Analytics - Issue 121
November Digest: A Whirlwind Of All Things Analytics - Issue 121
November recap: case studies, reports, analysis, and tutorials you may have missed

With a lot happening in November, I decided to reach out one more time this month to offer help and share quick top takes that are (or were) on my reading list this month or caught my attention in some way.
❤️ Giving back
November was a dark and difficult period with many layoffs. Even though I do believe analysts and data scientists should be less likely to be affected by layoffs (after all, someone has to stay and count money or detail how many users are left. And wear the “data-driven” hat if matters), we still are like any other role and are not immune to layoff circumstances. That being said, the demand for analysts now is very high:
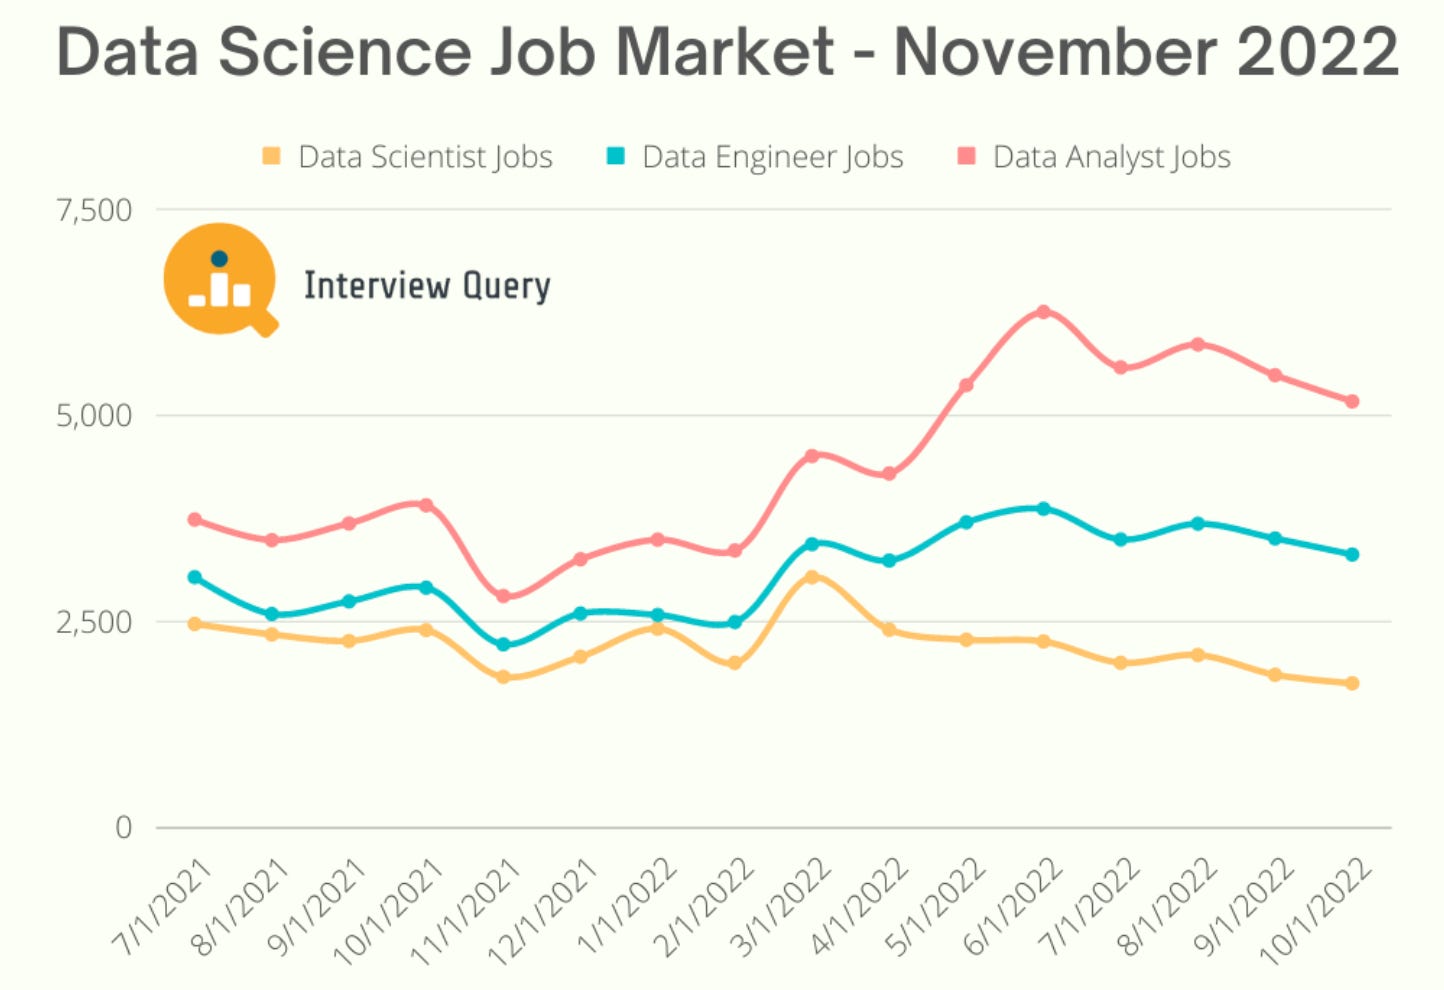
From Interview Query
If you have been affected by recent layoffs, or are in a position looking for a job in data science and analytics and would like to get a subscription for free, please fill out this form. I will set you up with a subscription for a few months and maybe make an introduction or assist in any other way. This year I received messages from my readers that my journal helped them land their first job, secure their dream job, or get promoted. Hopefully, it will help you as well.

⏪ A Rewind Of Last Month
Case studies, reports, analysis, and tutorials you may have missed
🔊 Advocating for analytics
Last week I published a possibly too direct recap of the Amplitude Growth event - Growth, Loops, And Some Hard Truths, where I voiced my frustration over the lack of data analytics experts represented during the Growth discussion and underlined that you are unlikely to unlock growth without heavy quantitative analysis. After I published my recap, Amplitude responded to me and acknowledged their lack of data precision instrumentation. They mentioned that they are putting big bets on improving data quality initiatives, such as the ability to create custom metrics and introducing Object Management that can help centralize and increase confidence in analytics. You are welcome.
🔥 What’s new this month
Regardless of recession and layoffs, many companies celebrated amazing growth this quarter, just to name a few:
YouTube now has over 80 million paying Music and Premium subscribers 🤯.
Airbnb posted its most profitable quarter to date with record revenue despite inflation. As I told you to check the Amplitude product usage report, where they reiterated that travel surged this year, growing by 33% YoY.
Uber reported a massive 72% jump in revenue. But hold your horses! It’s 2021 YoY. So it’s still below 2019, right? But nice storytelling.
If you missed the Coalesce dbt conference in New Orleans, here is a great recap.
📈 New reports and benchmarks
SAAS benchmarks report 2022 from OpenView and
Kyle Poyar
The Product Report 2022 from Amplitude
State of AI Report 2022 from London AI investors Nathan Benaich and Ian Hogarth.
Churn rate benchmarks (updated) from ChartMogul
🤓 Analysis and case studies
From Meta Engineering - How Instagram improved notifications with ML and analytics. With the countless types of notifications and high demand to engage users at all costs, how does one keep the sweet spot between a high click-through rate and a delightful user experience? The answer is through personalization and solid analytics. In other words, send (and spend) less, target right. Cohort, cohort, cohort.
From Airbnb ML and AI - Airbnb: How AI Text Generation Models Are Reshaping Customer Support. An interesting read about how to use AI (the real-time text agent assistant model) for customer and community support products: the real-time agent assistant model is an exciting read.
The End of Excel? You wish. This is a good write-up on how Notion, Quip, Coda, Airtable, Rows, Ationdesk, Casual, Grid, and many others are trying to kill Microsoft's monopoly, and why this is so hard. The old king is dead, but will never really die.
A fun interactive visual from Washington Post - The world population just hit a milestone. Here’s where you fit in.
⚙️Know your craft
Postgres Databases and Schemas - a primer on databases, schemas, and clusters in Postgres
How to load data into a database from CSV, JSON, and other formats - Data Loading in Postgres for Newbies.
A few weeks ago I published an introduction to Python plots where I described the differences between seaborn and matplotlib. If you want to get more comfortable with seaborn and level up your skills, check out this introduction to the Seaborn Objects System.
One of the things I strongly advocate for is merging data engineers, data scientists, and analysts under one umbrella (read my oldish How To Structure A Data Team). These roles complete each other and share the same KPIs, instrumentation, framework, project management workflow, and documentation. If you are “lucky” to get separated into different team streams, make sure your data engineers have a clue about what they are working on. Because it will impact your whole analytics. Start here - Data Is The How, Business Is The Why from
📚 Weekend Longread
A Quantitative Approach to Product Market Fit - bookmarking for myself a solid consolidated guide on marketing and premium framework reporting. The Tribe Capital data science and analytics team shares their approach to quantify and report on product market fit and goes deep into metrics calculation, definitions, caveats, and everything growth analysts should know. Highly recommend reading and following.
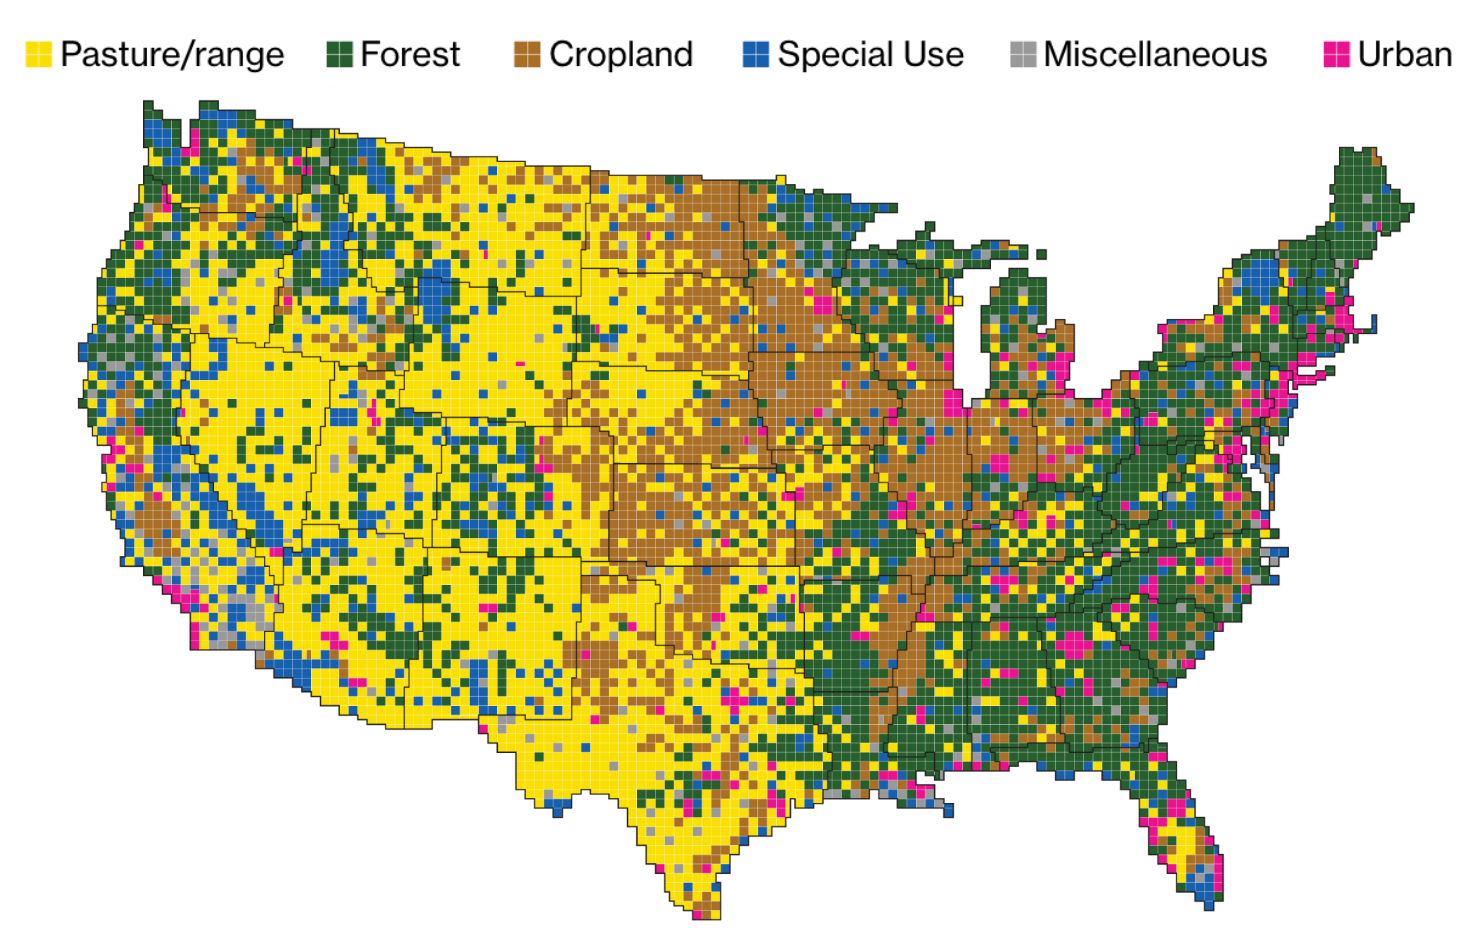
📊 Monthly Chart Drop
This is old but one of the best data storytelling examples I have seen, so I wanted to share it today. From Bloomberg, here is how America uses its land:
Thanks for reading, everyone. Until next Wednesday!