
Discover more from Data Analysis Journal
Hello and welcome to the first edition of my newsletter!
My name is Olga, and each week I tackle questions and topics about data, analysis, data science, and business intelligence.
You are receiving this newsletter because you subscribed to my Data Analytics Journal and are about to become very data knowledgeable.
This week’s highlights:
Scaling user growth + SQL hack - User Segmentation Technique
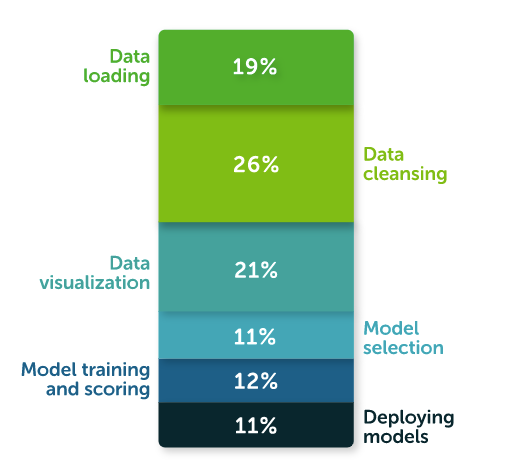
How much time, on average, do Data Scientists spend on data cleaning?
Brian Balfour takes on the danger of benchmarks traps. Is adopting a metric the right way to generate growth?
The NumPy community survey is currently underway. Please fill it out here to make NumPy even better.
Join us on July 30 for the DSS Elevating Women in Data web conference.
Weekend Longread
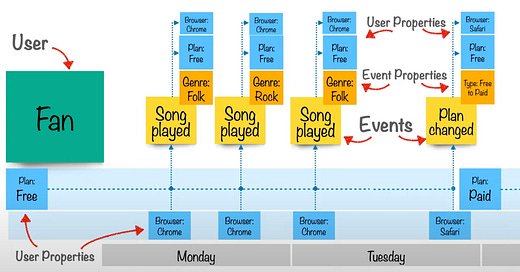
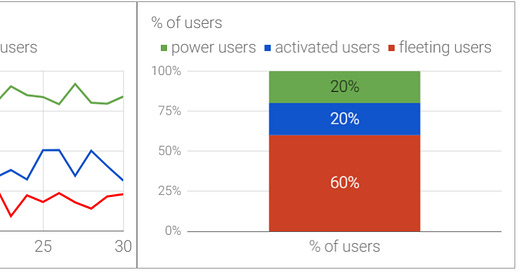
As a product owner, you should understand that only a percentage of your whole user base will become returning customers. Thus, the more you focus on understanding user behavior and motives, the more you can do to increase your user growth, and as a result — revenue growth. One of the ways to achieve that is to segment your customer into the right groups and identify a power user category based on user actions and behavior.
Read about the User Segmentation Technique, learn how to identify power users on your platform, and how to use this information to scale your user growth using SQL.
What’s new this week
Sad truth - Data Scientists spend most of their time doing data cleansing, according to a recently published Anaconda survey:
This is especially the case if the dataset contains DateTimes... Just accept the DateTime formatting curse.
Good news for users of Google Sheets! Google introduced a few nice updates (Smart Fill and Smart Cleanup) that simplify building spreadsheets and analyzing data (by autocomplete, improved formatting, and eliminating duplicate rows).
If you are developing applications with a large number of database connections, check out Amazon RDS Proxy which became available last week.
Expert Spotlight on Growth and Strategy
For my first issue, I decided to pick one of my favorite growth analysts, whom I enjoy reading, again and again, founder/CEO of Reforge - Brian Balfour. He writes about growth, strategy, and user acquisition.
Being a Reforge fan myself, I wanted to share his take on the danger of benchmarks traps. I often see how companies put so much pressure chasing a specific conversion rate (by rushing through the A/B testing, shrinking deadlines for analysis, forcing media campaigns too early), but different businesses often measure the same metric completely differently. Averaging or adopting a metric can be misleading and there are often better ways to scale up. Check out Brian’s analysis to learn the best practices to approach and measure growth.
Some takeaways from Growth Benchmarks Are (Mostly) Useless:
“If you are benchmarking, you naturally want to benchmark against best-in-class competitors, not an aggregate average of a category, but your benchmark report or tool may not show that spread.”
Different products and business models require different ways to measure customer acquisition cost and other key metrics.
If you have multiple tiers in your SaaS product, instead of an average CAC you should look into different customer segments CAC, with each segment paying different subscription fees.
Think hard about the product value proposition, target audience, and other elements that might impact the numbers. Try to get segmented numbers as well as a holistic view. Ask “why” something worked.
Drink and Mingle
Upcoming events, meetups, talk, webinars
July 15 Women Who Code: Python and DevOps
July 17 Career webinar: alternative career paths for engineers
July 21 Time Series SF: The Virtual Edition — July 2020
July 22 SF Data Science: Storytelling for technologists (and everyone)
July 22 AI model training and inference on Protected Health Information
July 29 Snowflake + DataRobot: Go from Data to Data Prep, to Data Science
July 30 DSS Elevating Women in Data (I have a few free tickets left for this event. Let me know if you’re interested)
Do Some Good.
It pays back.
The inaugural NumPy community survey is currently underway. If you are a NumPy user or developer, please take the time to participate. Having limited human and financial resources is a common challenge for open source projects. NumPy is no exception. Your responses will help the NumPy leadership team to better guide and prioritize decision-making about the development of NumPy as software and as a community.
The survey will take about 15 minutes of your time. Click here to get started.
A few exceptional students I know are currently looking for a summer 2020 internship in data science and analytics. If your company has an internship program for university students, please let me know. Merci.
Try It Out
A quick Python exercise. Because it’s fun.
We have a loud talking parrot. The “hour” parameter is the current hour time in the range 0..23. We are unable to sleep if the parrot is talking and the hour is before 7 or after 20. Return True if our rest is being disrupted. Try it yourself and check your solution here.
Until next Wednesday!
Subscribe to Data Analysis Journal
Where product, data science, and analytics intersect. Trusted by tens of thousands of data scientists around the world


