Top 10 Tools Every Analyst Should Have - Issue 103
Helpful tools and applications to have for data analysis and data science that can save you time and effort.
This week I bring you a refreshed list of my favorite tools and applications that aim to save you time while working on smaller projects that are simple but possibly time-consuming. They can help you automate some repetitive tasks or serve as another source of data validation. Some of these are applications that have to be installed and configured, others are quick online tools and calculators.
🗄 Tools for data acquisition (IDE)
1. DataGrip
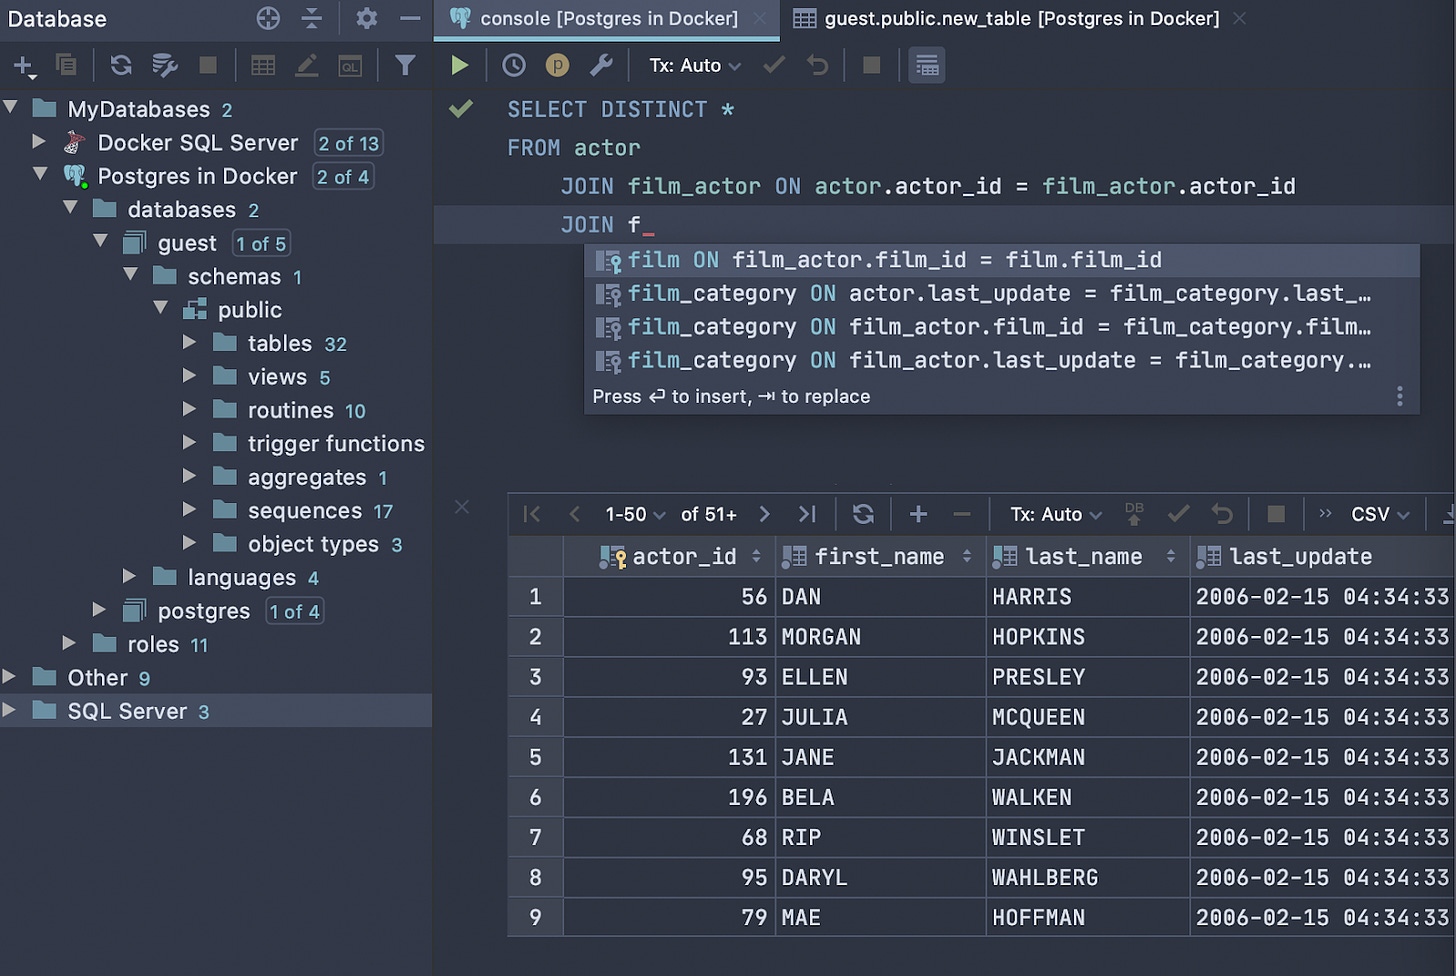
DataGrip is THE BEST database management system out there.
Why I like it:
Easy to install and connect all databases (PostgreSQL, Redshift, MySQL, SQLserver, SQLlite, MariaDB, Vertica, Hive, OracleDB, Snowflake, MongoDB, etc) to one client. As you know, many companies use more than one database, and structured and unstructured data can be distributed across multiple sources. DataGrip makes it easy to access and query different databases.
You can work on multiple consoles and run queries in different modes simultaneously.
It keeps a query history and activity log so you don’t lose anything.
It also serves as SQL file storage, giving you a quick way to access and open that one specific query that you worked on over 3 months ago.
It lets you explore schema navigation and view diagrams that show you how tables are connected and what the keys are
You can run a sophisticated EXPLAIN function that can give you a hint about how to improve your SQL performance.
It supports smart code completion, so you don’t have to remember every long_unintuitive_table_or_column_name, and it auto-completes names and keys for you! It also suggests the right keys to join tables. So cool.
It detects syntax errors and suggests options to fix them.
It has sophisticated refactoring. For example, if you rename a variable, it will update their usages through the entire file.
Integration with git and much more.
I’d highly recommend getting the license for this IDE for your team or using this client for your local database on your laptop. It makes my daily routine working with SQL so quick and efficient.
2. Simplql
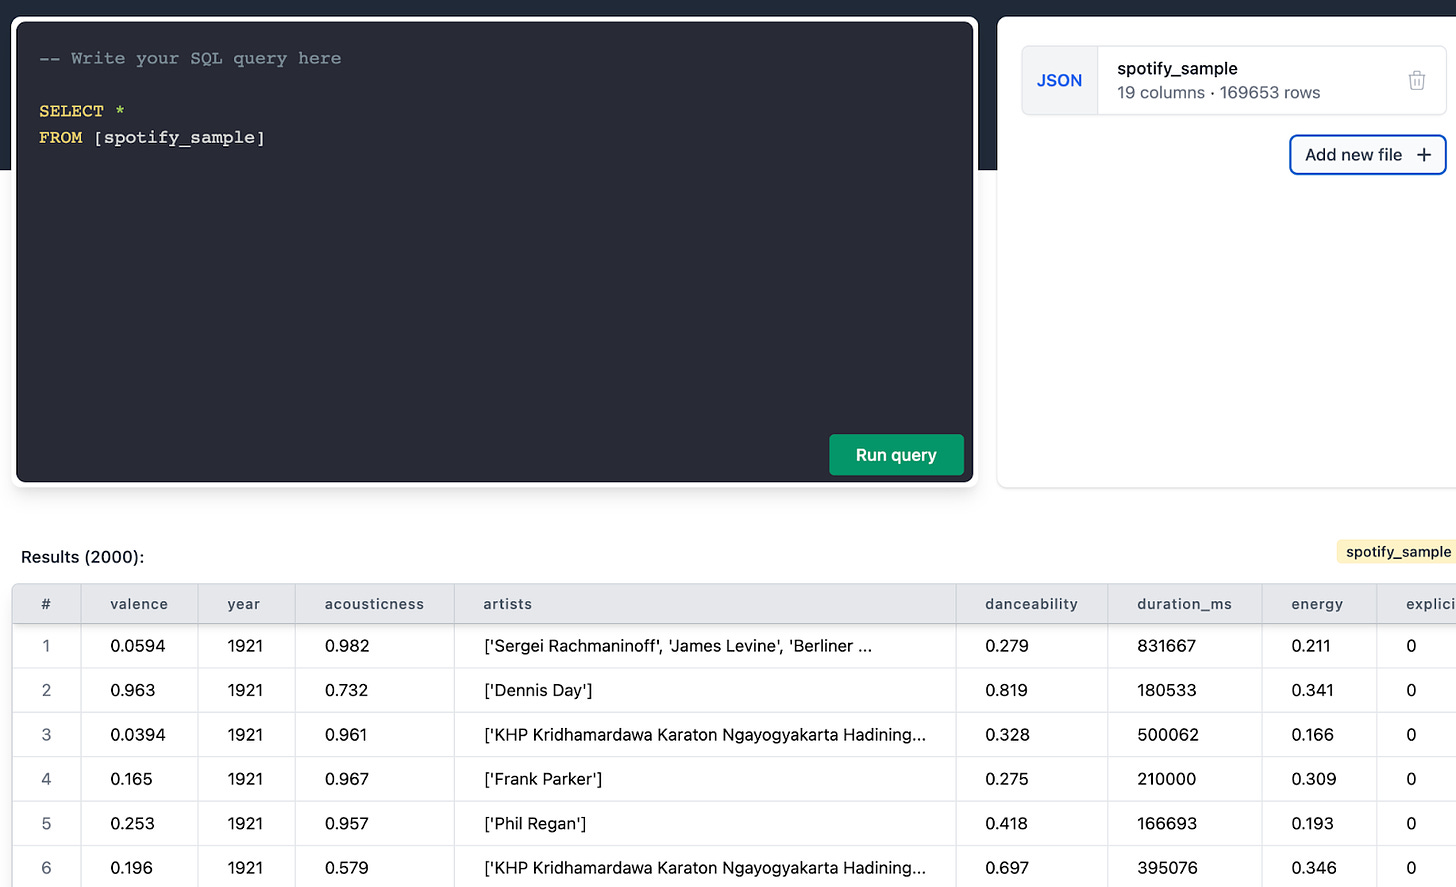
If you don’t have access to a database or a time/need to install one (for example, during a hackathon, home assignments, a competition, or technical interview where you have to analyze a chunk of data “on the fly”), Simpleql comes to help!
This is an in-browser tool that lets you query data files with SQL without using a database. It does everything in the browser and doesn't upload your data files to the server. Users can export the results from their queries in CSV or JSON. Easy, fast, intuitive.
Note: before I learned about online querying options, I used to leverage SQLite for such a type of quick analysis. It was meant exactly for that. You can quickly install it on your machine (or even a cellphone!), it doesn’t require much configuration and runs fast.
⚒️ Tools for data processing and transformation (code editors, notebooks)
3. Sublime Text
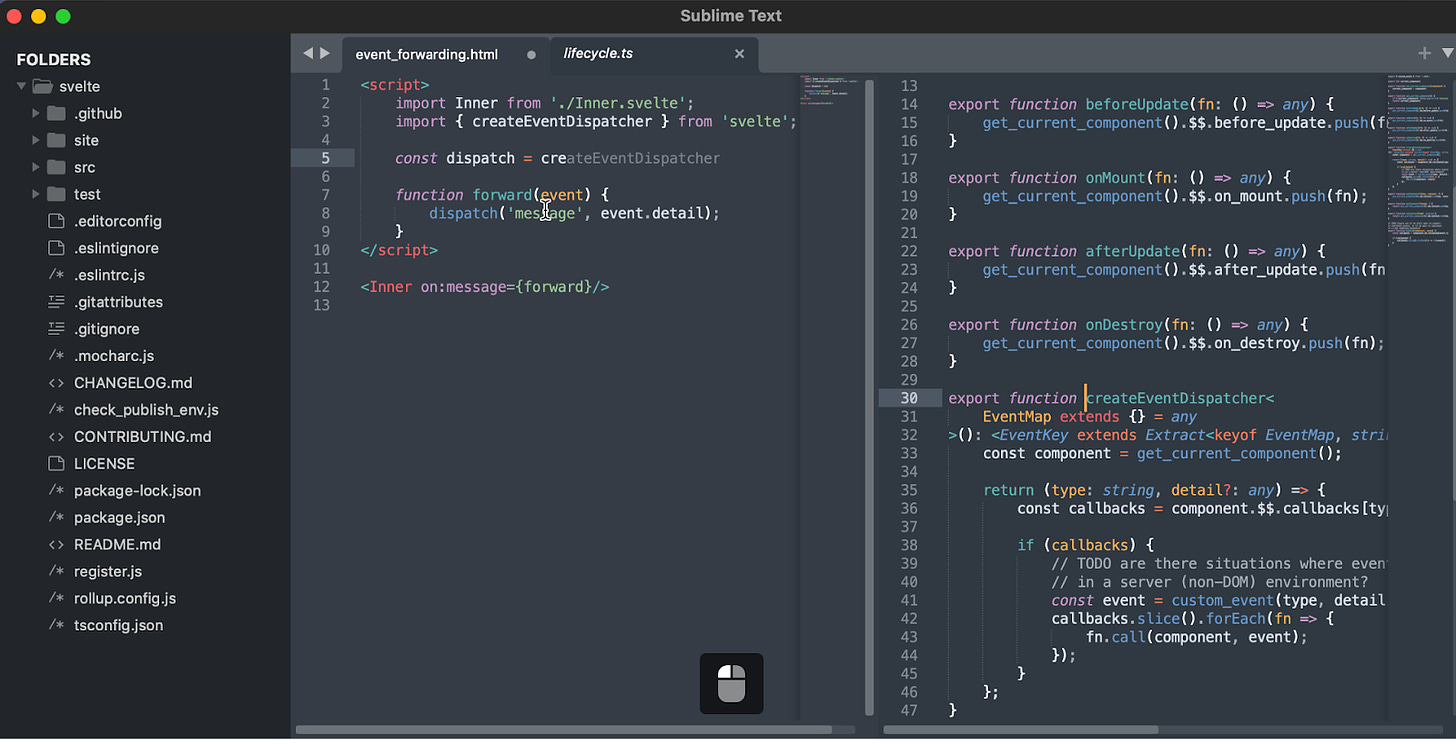
Many colleges don’t agree with me on this one for some reason, but I think Sublime is really underrated. It is a solid alternative to Visual Studio or Atom or PyCharm. I have been using it for many years and I just love it.
I’ve tried other editors, yet I always return to Sublime for its speed and flexibility. For data processing and transformation purposes, it works great. Specifically:
It has a simple layout, not too complex or distracting like VS or others (the overwhelming sidebar, complex search, panels with features that I don’t need, etc). I like how simple and intuitive it is.
It runs very fast and has many convenient editing features.
It lets you select multiple lines, words, and columns and run edit or replace commands in seconds.
If you want to go extra fancy, you can install Package Control and have all the plugins and features available like other editors. Or you can install Sublime Merge and work with Git client. For example, I have Formatter installed for Python or JSON and SqlBeautifier for SQL to beautify and format language.
Once again, if I were an engineer, I would probably go with VS or PyCharm to have an integration with other apps. For analytics purposes, I am looking for a simple and good text editor with solid autocompletion, syntax highlight, and formatting. And for me, Sublime does the work.
4. Jupyter Notebooks
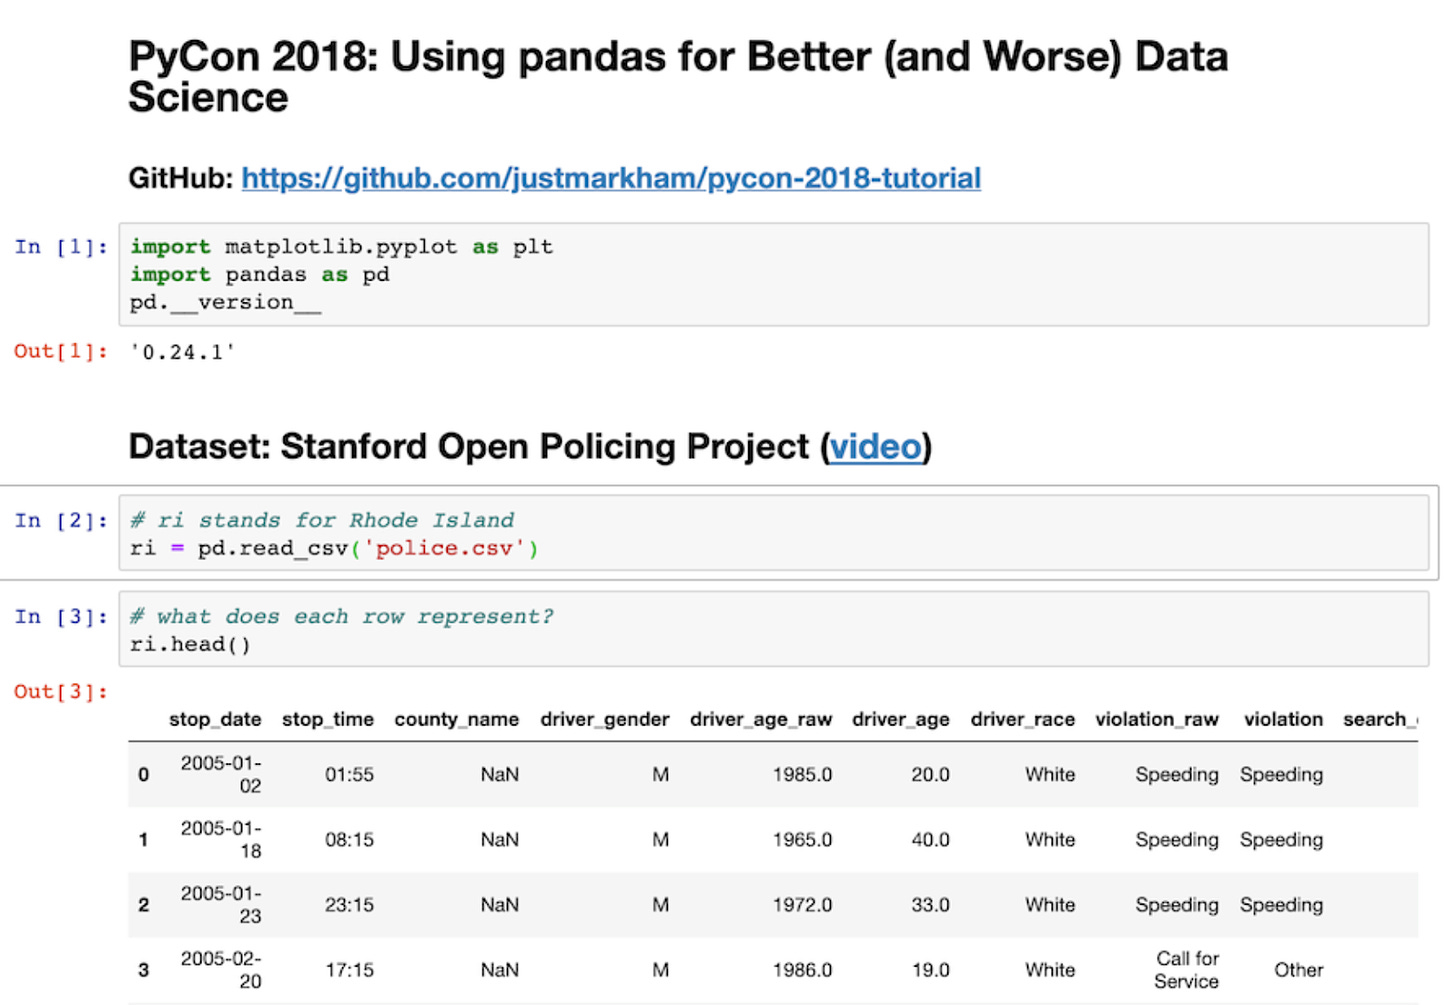
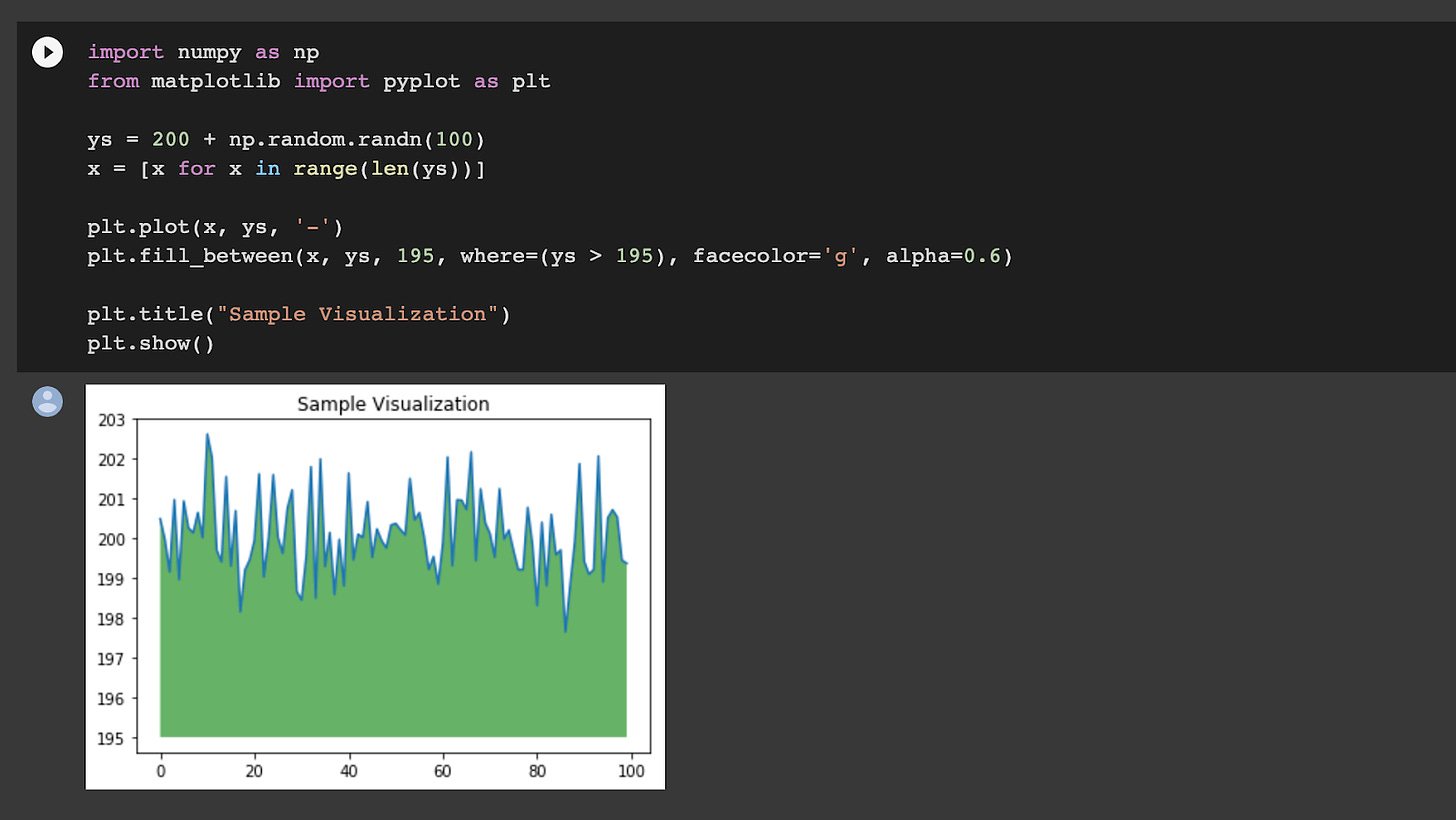
Notebooks are very easy to work with and share your code, regardless if you are using Python or R for data analysis (they work with Scala, Julia, and other languages too). They’re easy to start with and very intuitive. You can keep your code and run rich HTML output with images. Notebooks are one of the easiest ways to work with pandas, scikit-learn, ggplot2, or TensorFlow.
Notebooks are great for presenting an analysis or case study where you have to display code, your approach, and output examples and plots. It does wonders for that and is the best tool for such presentations (unless your data lead still lives in the dark ages and requests a deck for every analysis you do. Update them by showing how humans have harnessed the power of electricity and go from there).
The biggest drawback with Jupyter notebooks I find is that it works locally, and it’s not easy to add more users to work on the same notebook (although, I know there is a way to do that using JupyterHub). For that reason, while I love Jupyter, my first go-to notebook is Colab.
5. Google Colab
The only difference between Colab and Jupiter is that Colab is cloud-based. So you don’t need to install it and there is no need for configurations. You can simply open it from a browser, invite your team, and work together on the code just like you do would collaborate in a Google doc.
In a way, Colab is like Kaggle, but I like it more because (1) it runs way faster, especially if you use TensorFlow, and (2) it lets you store and save work to your Google Drive. It makes it easy to upload to GitHub repositories.
📈 Tools for data analysis and statistics (apps and online calculators)
6. Excel
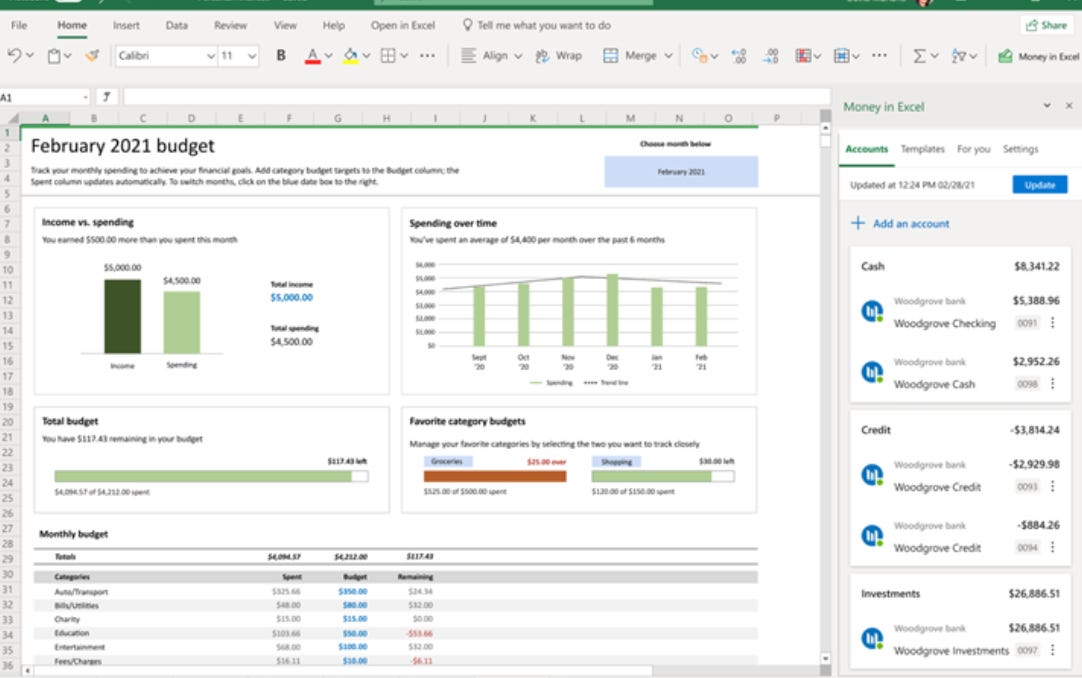
Call me old-fashioned, but I still use Excel for data analysis. A lot. I chose it over Google Sheets, Apache OpenOffice, LibreOffice, Zoho... None of these worked for me as fast as Excel with functions and pivoting flexibility. I use it for quick data wrangling, sorting, mapping, forecast validations, quick calculations, and YoY or WoW analysis. For complete data analysis, Jupyter Notebooks is the way to go, but for smaller sets or financial forecasting, my preference still goes to Excel.
7. Wizard
I love Wizard so much. I’ve been using it for quite a while, and every year they keep improving and adding new features. This is a great tool for statistics and data analysis. This is a very handy tool when you have a new dataset but don’t yet know what you are looking for or what questions you’ll have to answer, what the data patterns are, structure, etc.
Wizard has advanced pivoting, nice graphs, and built-in test statistics. To be fair, it takes quite some time to get started and become familiar and comfortable with it, but once you are set, it opens so many paths for analysis and modeling.
After installing Wizard, you can import a file and run Exploratory Data Analysis in seconds. The tool will instantly show you if the data is significant, what p values are, what the distribution looks like, what outliers there are, and confidence intervals.
I use it primarily for quick summary and correlations, but it also supports advanced multivariate modeling using logistic, negative binomial, proportional hazards models, and more.
8. Online calculators
Here is a list of my go-to quick calculators if I have to quickly answer a math or statistics question while being in a meeting, or without the ability to run an estimation analysis. Some of them contain formulas and a good explanation of logic and theory. You can take their methods and adjust your input values to get a more precise estimation.
Sample size (Optimizely) to determine the needed sample size for your experiment.
Rate of success (Evan's) to compare the rate of success across 2 groups (Chi-Squared)
Significance calculator to evaluate your test significance, confidence, and result.
Standard Deviation calculator helps you get confidence intervals, population variance, and a distribution pattern.
Probability calculator - instantly get the probability of 2 independent events or a series.
Percentage calculator - because when we are drunk, we screw up our tips.
I’d recommend not relying on these while developing your model or analysis, but rather using them as a check, quick estimation, or validation of your findings.
📊 Tools for data visualization
9. WordArt and WordCloudMaker
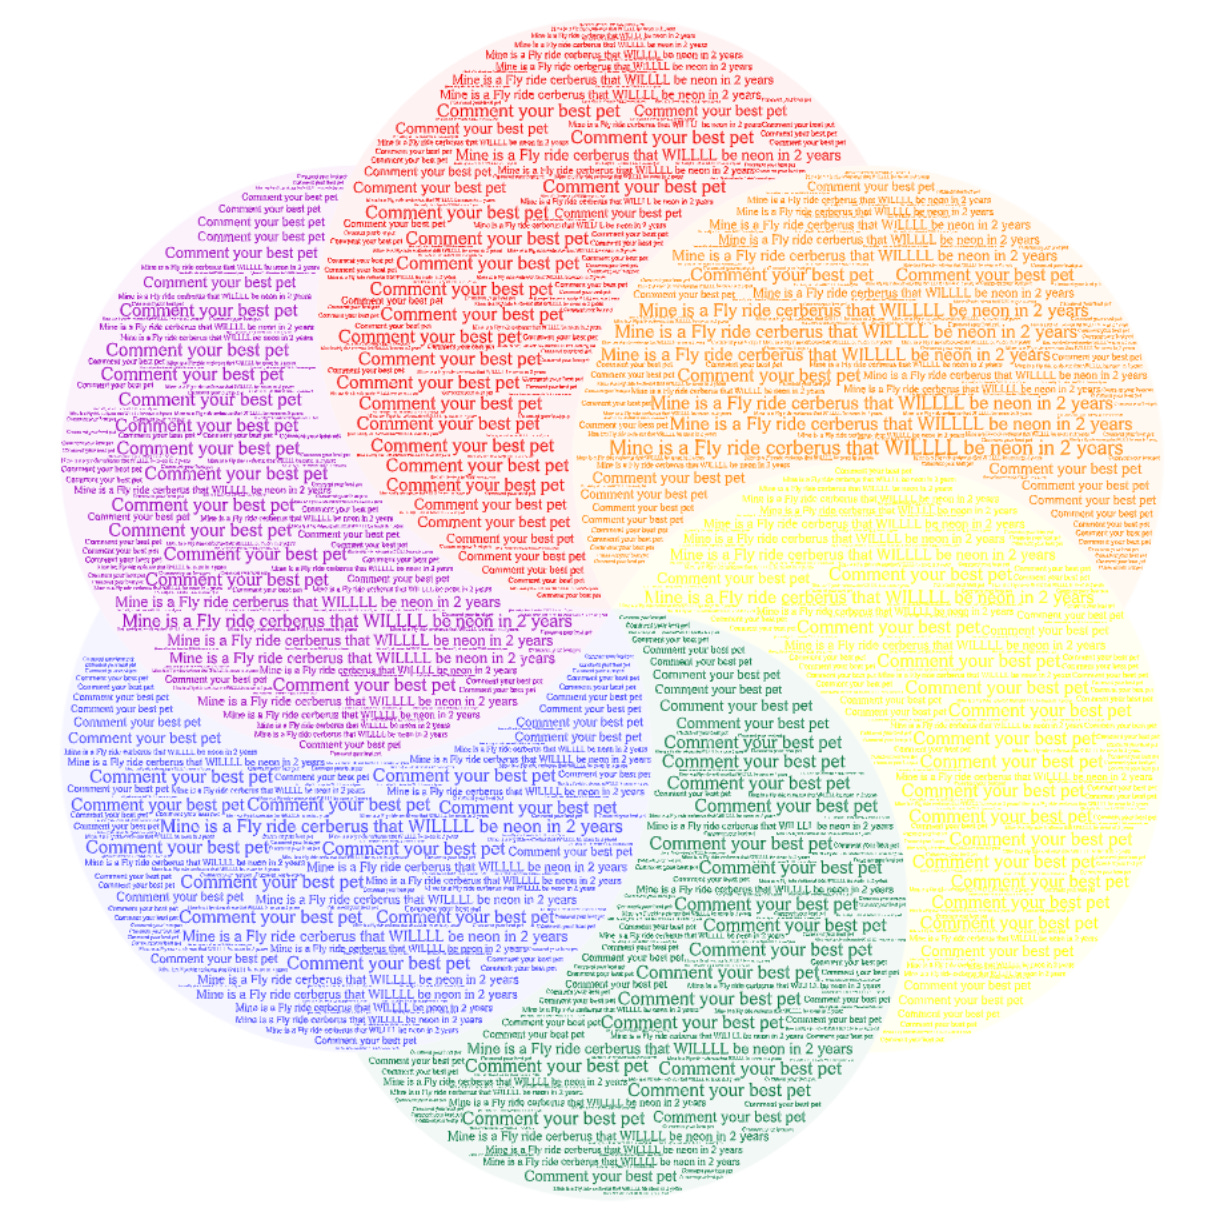
For a fancy text visual and a quick word cloud map, these tools are simple and fast to use. You have to upload your text file, pick a visual (or upload an image) and it generates a word cloud in seconds. I wouldn’t use these tools for complex data maps which require textural data cleaning or tunning. That being said, for a quick word map or cute visual pattern to complement an EDA or a case study, these are good online tools.
10. ChartBlocks
Even though I use Excel for data analysis, I’m not a big fan of Excel’s charts and visuals. For a deep dive or a case study, I’d use matplotlib.pyplot a Python plot package with either Bayesian (plt.style.use('bmh')) or R ggplot (plt.style.use('ggplot')) style sheet.
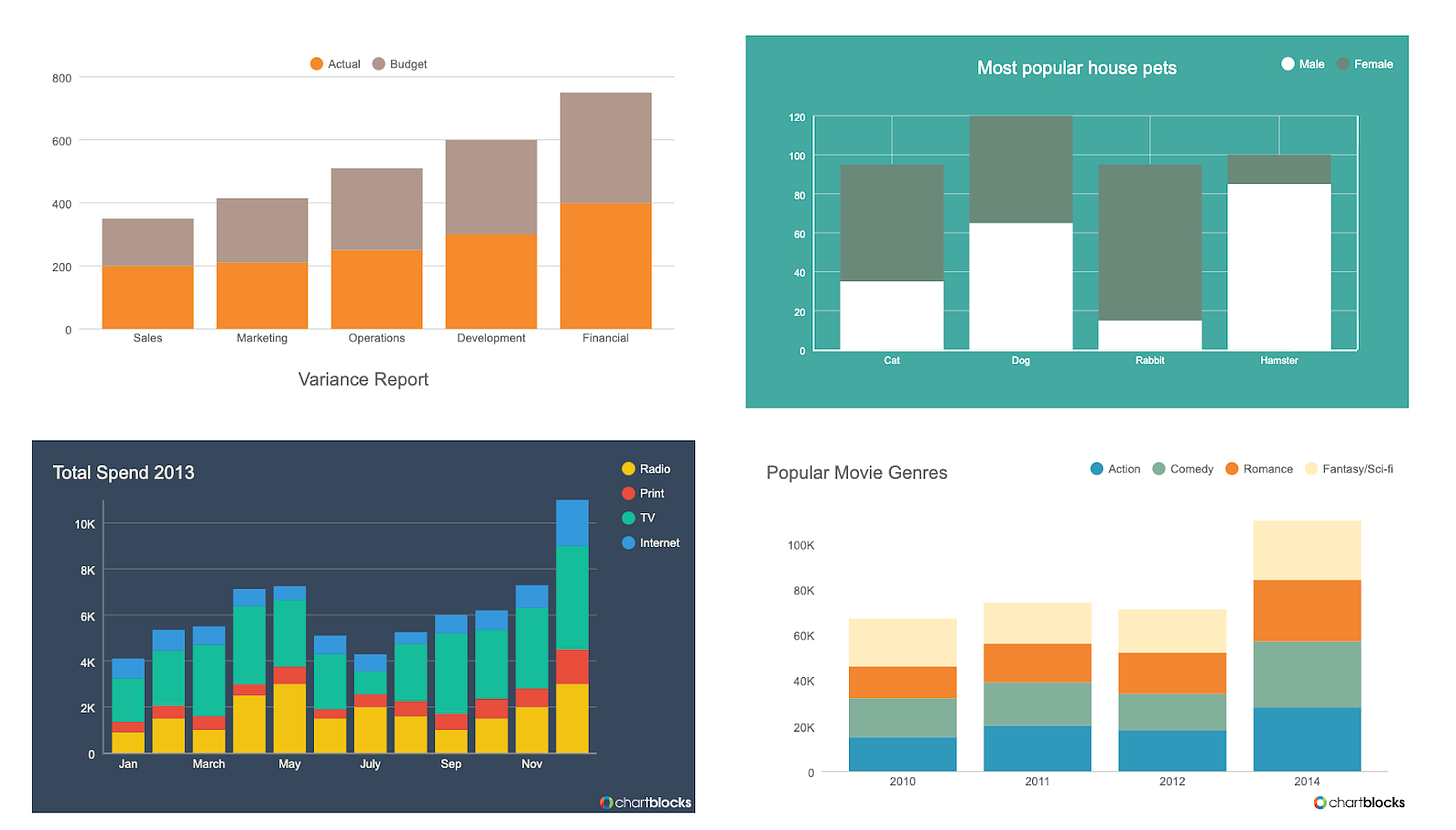
For a presentation deck or reporting, where I have to quickly put the chart together without spinning a notebook or spending time figuring out plot colors and size, I secretly use an online chart builder like ChartBlocks. You can import the file and create a chart in minutes. They also provide guidance on what type of chart suits you best, depending on what data format and type you import.
By and large, these are all the main applications that I’ve used for many years. Different projects require different tech stack, and data analytics roles always merge and change, so we have to stay open and explore other applications all the time. Hope this helps!
Thanks for reading, everyone. Until next Wednesday!


