
User Segmentation and Power User Analysis in SQL
What are user segmentation techniques? How to locate your Power users? How to do user segmentation analysis in SQL?

Scaling your user growth can be very challenging and has many strategies. One of which is to analyze your user acquisition and measure your user behavior by grouping your users into segments by the market or product definitions. As a product owner, you should understand that only a percentage of your whole user base will return and buy your products or use your services again and again. Thus, the more you focus on expanding your user base and understanding your user behavior, the more you can do to increase your user growth, and as a result — revenue growth. And for this, a data analyst can help you sort your customers into the right groups, define a power user category, and provide a deeper understanding of your user base.
User Segmentation Technique
Quantitative user profiling is one approach to segmenting and defining user categories based on the data you collect. It helps to divide your user base into cohorts based on user activity level and your top marketing/product metrics: MAU/DAU (monthly/daily active users), user engagement, retention, etc.
Before we jump into analysis steps, let’s clarify the definition of user profiling and a few terminologies first. Who are your power users? How do you define them? What actions do you look for?
Power Users Bring You the Most Value
As a consultant working with different clients, I run into various terms for power users — super users, influencers, whales, alpha users, etc. It doesn’t matter what you call them, but it’s important to understand which user actions you have to look for in order to define this powerful category.
The idea behind it is simple: your power users bring you the most value. How you define the value depends on your company size, sector, location, or product/service. Since we are speaking of user growth here, you have to aim for increased user acquisition. Therefore, the power users would share/promote your content and bring you the newest users. A common approach for defining the power user in marketing is to follow this process flow/funnel:

Action: A baseline user action event. The action can be a purchase, an order, signup, or even a simple “view event” if it fits your product model.
Share: Another user action, but dedicated to sharing your product or your content on social media or via other channels you offer.
Recruits: Users who are recruited by a Share action. Usually, these are new signups who come from the Share by a parent user. A parent user is often called a recruiter, and the new clients they bring are called recruits.
Influence score: A defined complex metric that shows the proportion of recruited users for each Share action event.
Getting Power User Data in SQL
Regardless of how you collect and store data, you have to end up with a clean set of aggregated Action, Share, and Recruits events in order to calculate the Influence Score. Often data comes from various channels, like Salesforce or Google Analytics, and some of these events may already be stored in RDBMS. Therefore, if the data is stored in different tables, you can create a temporary table or a view in a database for easier data acquisition. Below I will demonstrate querying the power user category using PostgreSQL and RedShift database (Amazon RedShift data warehouse).
Step 1: Get clean Action, Share, and Recruits data for the right period of time (I am using 6 months of data):
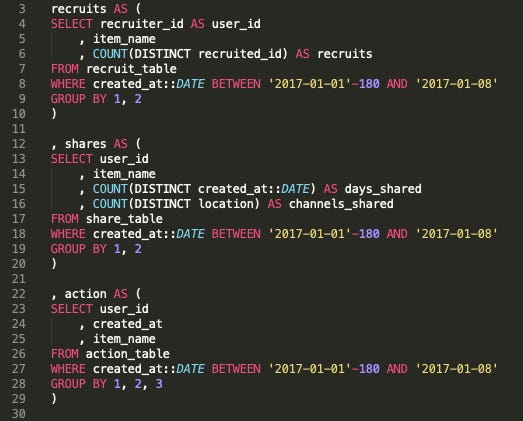
Check the code here
As you can see, the first subquery returns Recruits data along with recruiter id. The second subquery gives Shares as well as share channels and share timeline, which I aggregate as days_shared. The third subquery simply fetches Action data for the same period of time. Make sure you query these three buckets for the same period of time.
Step 2: Assign an Influence Score and connect all subqueries together:
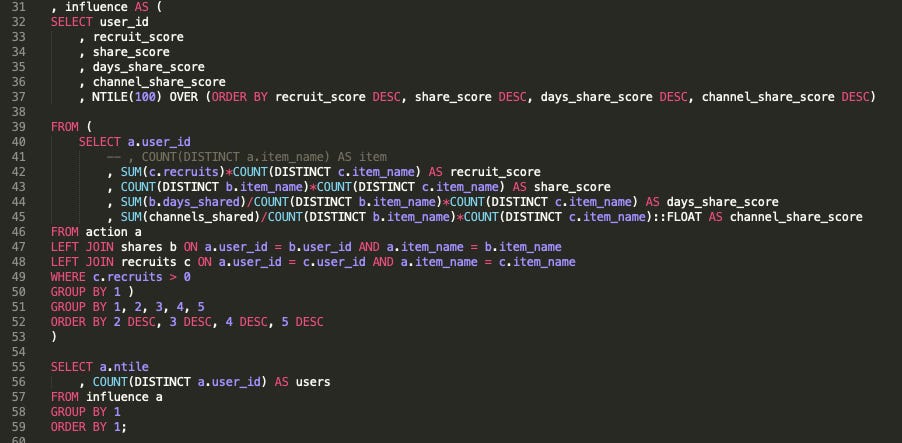
Check the code here
First, I connect Action, Shares, and Recruits subqueries and calculate a few interim metrics such as
Recruit Score: the total number of recruits for your product/feature
Share Score: share data for your product/feature
Days Shared Score: additional metric describing sharing timeline
Channel Shared Score: additional metric displaying popular sharing channels
After that, I assign the Influence Score for each user ID using the PostgreSQL window NTILE function, which is calculated based on the described scores below:
, NTILE(100)OVER
(
 ORDER BY
  recruit_score DESC
  , share_score DESC
  , days_share_score DESC
  , channel_share_score DESC
)
NTILE splits data into calculated groups and helps us rank the data from high to low. The highest score will be returned as 1, and the lowest as 100. Once again, we receive a proportion of users who have shared the most and recruited the newest users to the platform.
The final step is to fetch users who have the highest Influence Score (starting with 1). These will be our power users.
As the final step, you can filter this user category to include only specific returning users, or to include only one product feature you want to explore or test. Using the same approach, you can locate other user categories besides power users. You can define passive or churning user categories as well, and then compare them to find opportunities for bringing them back.
Quantitative user profile analysis opens a lot of potential for crafting your product strategy.
Effective and simple. Brilliant.
Excellent explanation. User segmentation is crucial for growth. By identifying and targeting key users through data analysis, you can enhance user acquisition and retention, leading to increased revenue.