
Summer Digest: A Whirlwind Of All Things Analytics
Summer recap: case studies, reports, analysis, and tutorials you may have missed


As we approach the end of the summer, I want to reflect on the big moments, breakthroughs, and advancements in analytics that have been achieved over the last three months. Today, I’ll share my bookmarked articles, new publications and tutorials, industry milestones and benchmarks, new case studies, and everything that was on my reading list this hectic summer that is worth flagging and re-reading again.
joined me today to contribute his share of updates across product analytics. Timo is the best product analytics advocate whom I am lucky to know. Together we discuss all things analytics in this (hopefully) short and light summer recap.
🔊 Advocating for analytics
Embracing the New Era of Accelerated Testing by
Testing today can evolve into a never-ending series of short A/B tests. There is no beginning nor end of a product feature iteration. Our previous academic approach to test evaluation doesn't work anymore. It holds you back, it blocks teams, and it's not scalable or efficient. Most analytics teams are not equipped or skilled for the current tooling. What a time to be nimble.
Product teams are the most quantitive data-avoiding teams I know. And to be honest. I don't really have an explanation for it. It is a post by itself to investigate it. So, for now, based on my experience and the experience of plenty of data people, getting product teams to work with product analytics is a tough job.”
What the hell is going on with data? by
.“The problem with good software is that it requires labor to build, maintain and improve, and there’s still no substitute for a bunch of people motivated by a common goal and passion in building anything of sufficient complexity.”
Lots of Fancy Tools, and No Idea How to Use Them by
“if tools are great, why are we still struggling to “deliver business value”? To me, the biggest issue in the data industry today is the massive knowledge gap about the basics of data and best practices for the tools we use”
🔥 Summer highlights
Given that (a) I am not a fan of ThoughtSpot and do not believe in their self-serve no-code mission and (b) Mode made a difference in reporting and shaped its type of analyst, I was disappointed with such a change. You may frame it “parallel” or “same destination, different sides” in this beautifully written announcement, but to me, it still feels like a step backward in analytics. Regardless of how one analyst might feel, congratulations to the Mode team and one of my favorite bloggers.
Announcing Python in Excel. The finance team can now use Python to calculate EBITA and Gross Margin. Terrifying.
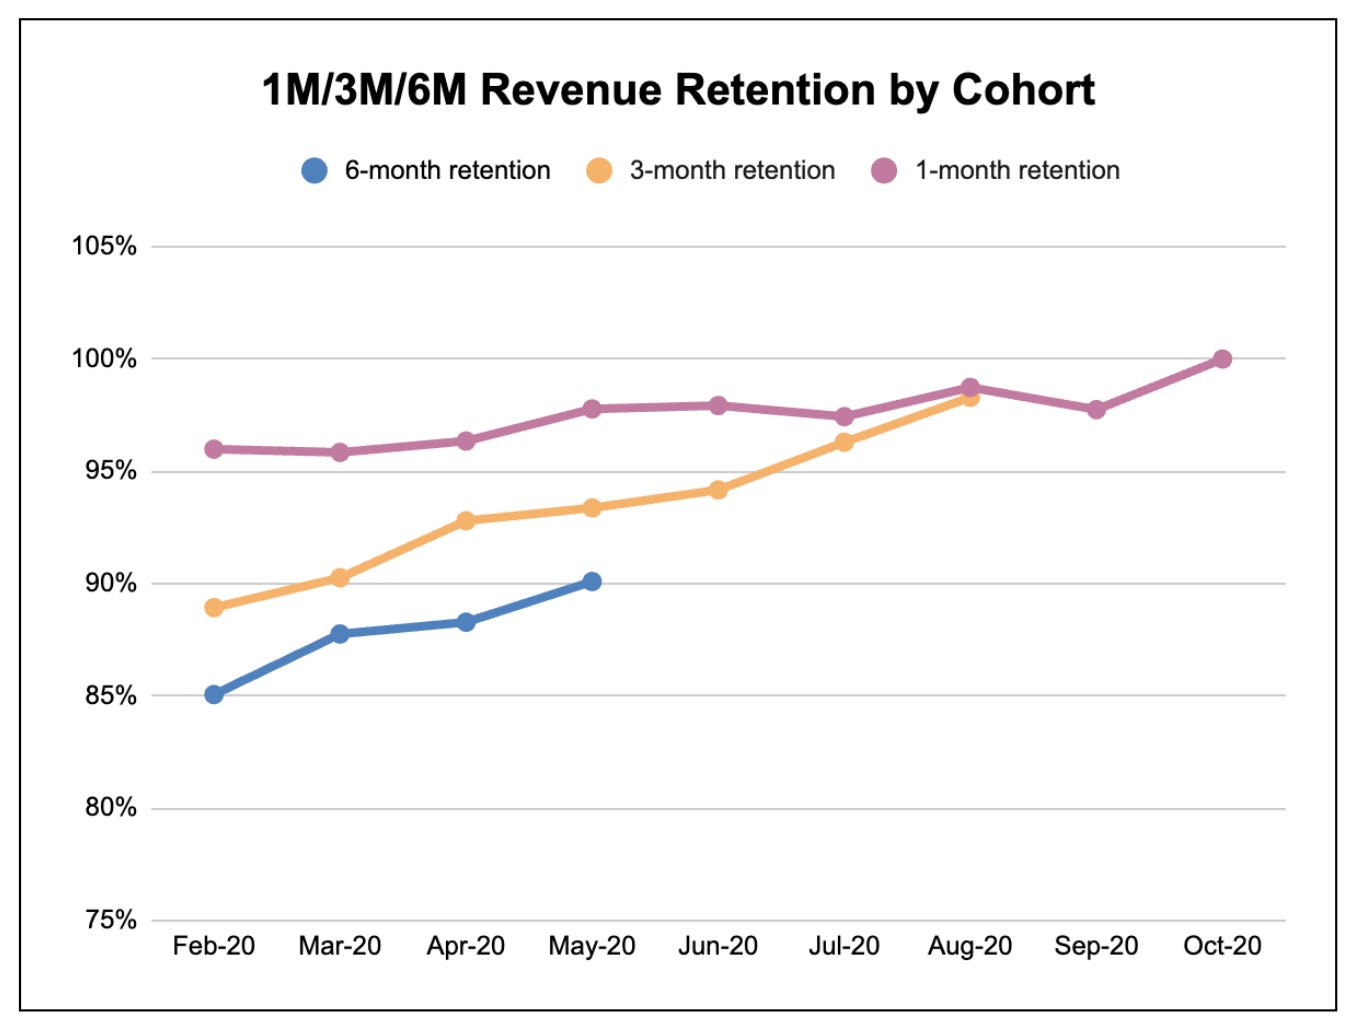
Finally, an ultimate and consolidated guide to cohort analysis we all have been waiting for, published by Christoph Janz himself. Read to learn how to do cohort analysis, visualize it, and read its graphs. Learn how to use cohorts to understand user behavior, retention, churn, and revenue over time, locate signals and data patterns in cohorts graphs, and bring them into data-driven decision-making. From basics to advanced questions, this is a must-read with templates and calculators:
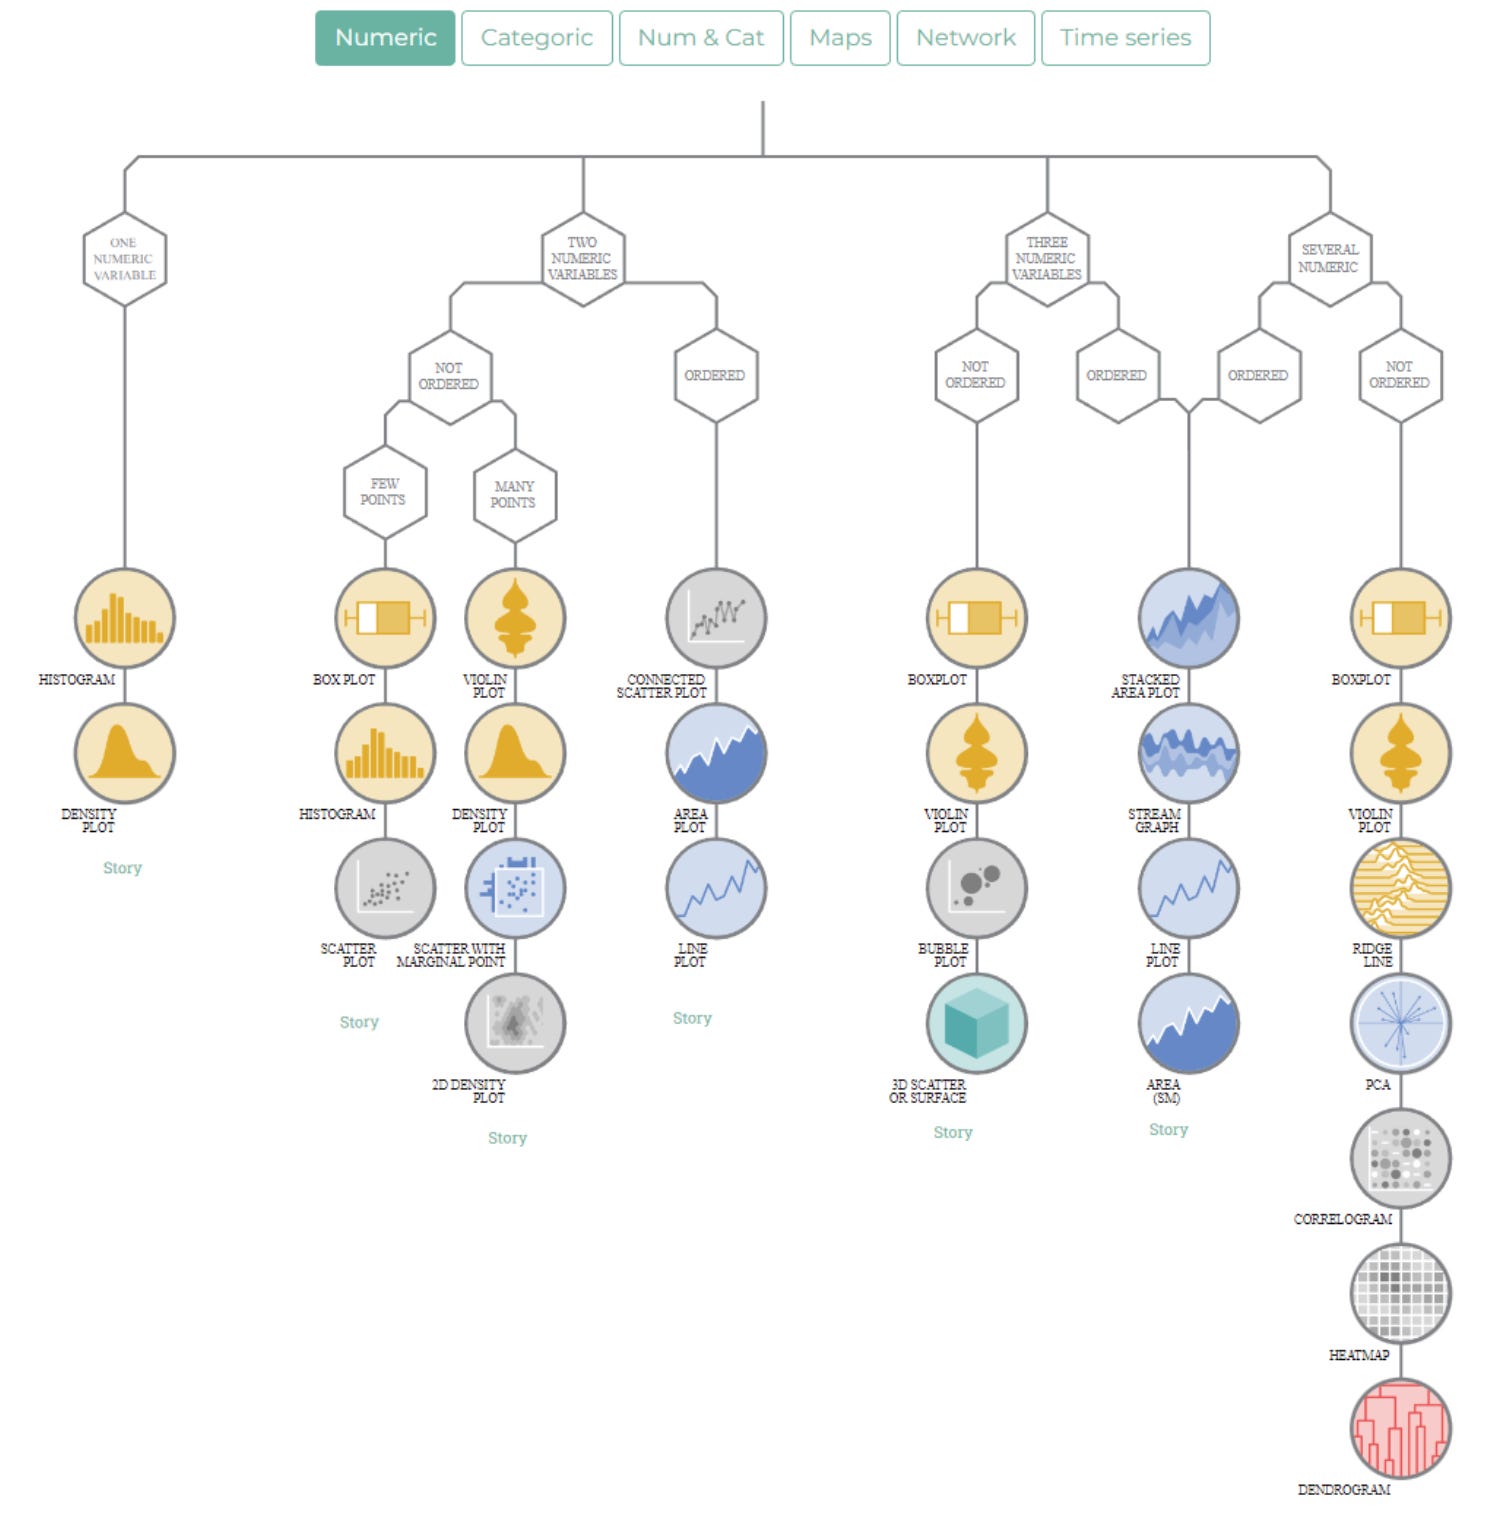
Royal Statistical Society (yep, that’s the name) published an ultimate consolidated guide on best practices for data visuals. It includes working with tables, extracting data values, and the right approach for picking the type of chart, colors, design, shades, and shapes:
People who know me (Timo) know that I see a bright future for product analytics on top of the data warehouse. First, it reduces instrumentation, gives more control over event data definition, lets you mix various data sources, and ultimately you end up with one place for the data and not two. Kubit and Netspring are the trendsetters with their products, but now Amplitude is taking the step to offer cloud data warehouse integration (beyond their existing DWH sync feature). Haven’t tested it yet, but it is pretty high on my list.
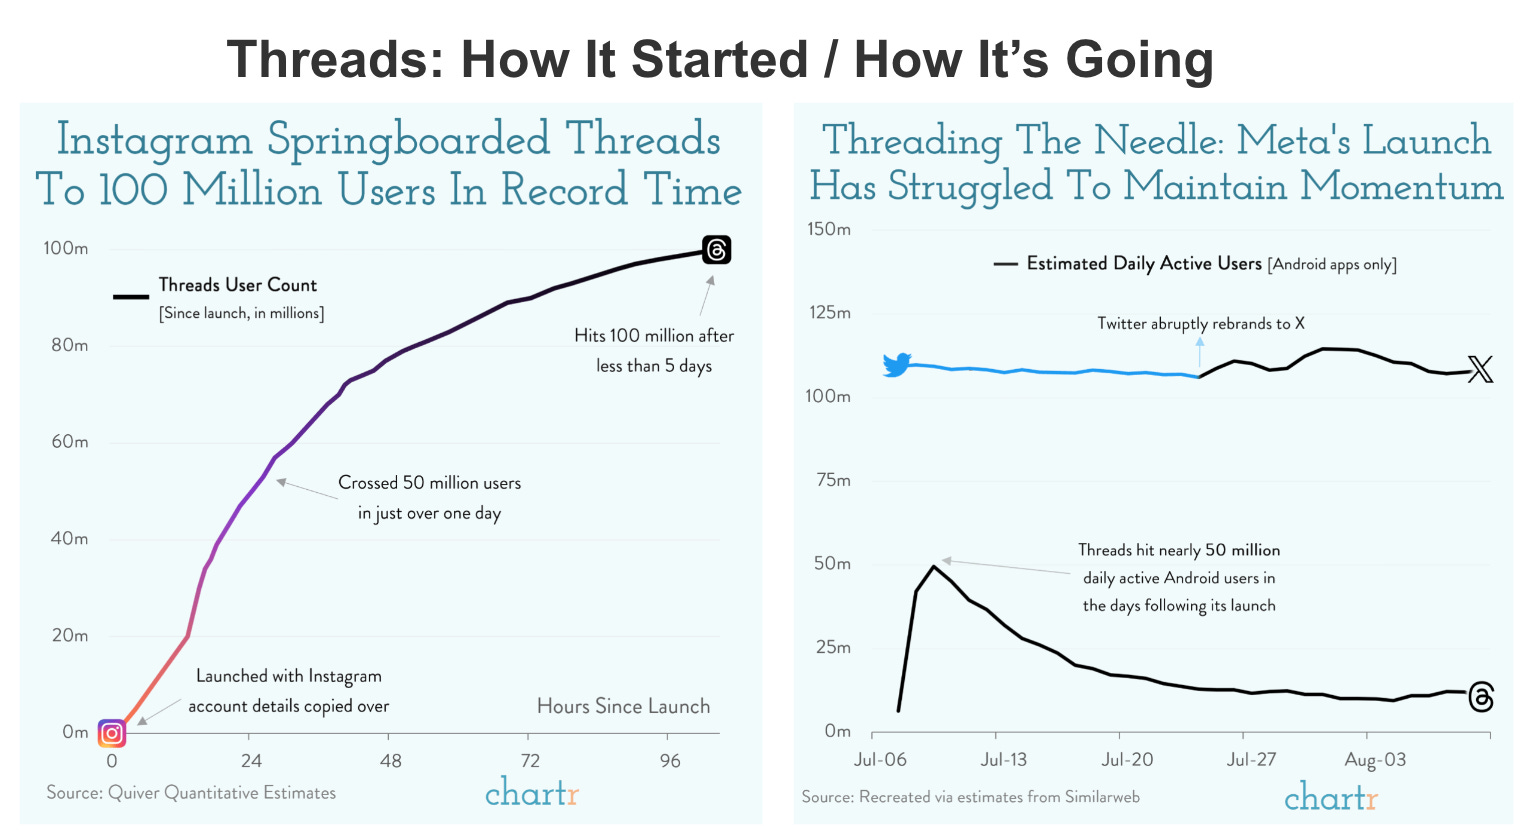
Social startup IRL has shut down after an investigation found that 95% (19 million) of its 20 million users WERE FAKE. They raised $200 million in venture capital. (Do not over-count DAU).
📈 Industry reports and new benchmarks
The Latest SaaS Pricing Trends from Bloom Equity Partners.
Full The state of AI in 2023: Generative AI’s breakout year report from McKinsey.
🤓 Analysis and case studies
Andrew Chen has finally returned from life wonders to blogging, indulging us with quite a few killer publications this month, one of which is an amazing write-up on user behavior patterns when things don’t look good.
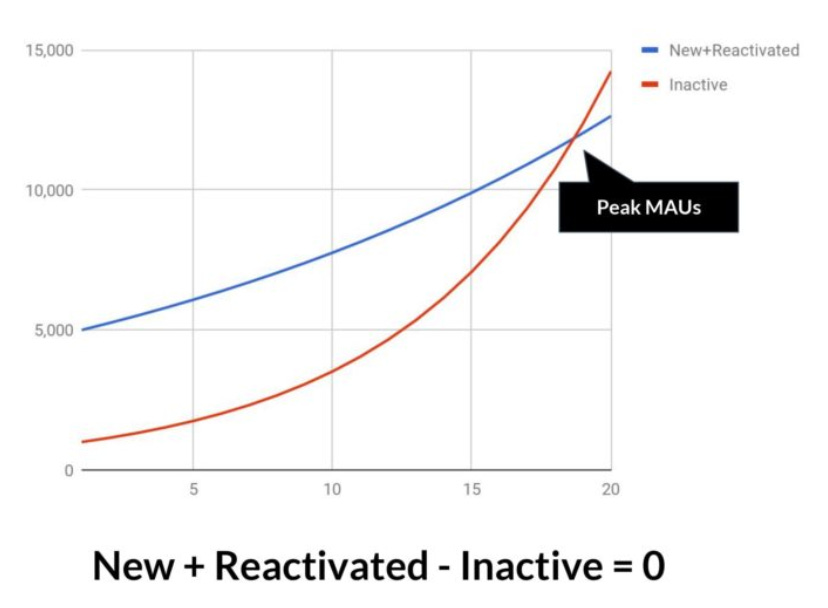
So the only thing left is to define inactive users. Easy.
Brian Balfour: A Breakdown of LinkedIn’s AI Assisted Growth Loop:
beat me by publishing his list one week before I was planning to release mine (and you can’t publish the same topic once someone has already done it. Bummer). His list is correct but heavily skewed towards finance (because it was written by a cool finance dude). I wish it would be more balanced out with product and marketing metrics. And congratulations on the podcast launch!“In March, LinkedIn launched an AI assisted growth loop. Fareed Mosavat and I recorded a convo where we broke it down step by step. We were shocked when we looked up the stats. From March to June it went from generating 0 to 1M uniques per month according to Ahrefs and is on one of the steepest growth curves we’ve ever seen for a content loop.”
A nice academic study was released this past June - Accurately predicting hit songs using neurophysiology and ML.
The team of researchers measured neurophysiologic responses to a set of songs that identified hits and flops. Then they ran it against multiple statistical approaches to examine the predictive accuracy of each technique. Once the highest accuracy score was achieved, they created a synthetic dataset and applied ensemble ML to capture signals in neural data. The model classified hit songs with 97% accuracy.
⚙️ Know your craft
A new great SQL book was just published! Data Wrangling with SQL: A hands-on guide to manipulating, wrangling, and engineering data using SQL.
300 pages that bring you right into advanced SQL level through databases and data tools overview, data types, DATEs madness, subquerying, window functions, optimizations, and more.
The reason why we decided to highlight this book is that it was written by analysts for analysts. It stands out as one of a few recently(ish) published books that walk you through must-know SQL for analysis and data science in a language you’ll understand, using examples we work with every day. The book has been dedicated to analytics chapters like outlier detection, time series, and descriptive statistics all in SQL, with examples and exercises. I highly recommend this as a must-read for BI and analysts.
Prerequisite: basic SQL knowledge and MySQL tolerance.
Functions are Vectors. We know you miss linear algebra.
Quick and handy Algebra Calculators. Check your W/W percentage change.
ML for Finance - a new academic paper was published this summer, surprisingly closely knitted into finance with projects, forecasts, and terminology we work with. Read 100 pages to learn how supervised and unsupervised ML is used for risk-return tradeoff analysis, estimating prices and wedges, predictions, and regressions.
SQL Window Functions tutorial - everything you have to know about window functions. A detailed guide with examples and nice visuals.
Make Beautiful (and Useful) Spaghetti Plots with Python - the art behind the stacked line charts.
Product managers and analysts might find this Managing Feature Flags guide from Split helpful. It introduces the concept of feature flagging (which is breaking down a product into a set of features that can be dynamically tested without redeploying code), its common usage (e.g. the product details page, carousel), and rollouts (canary release vs. experiment).
Updated one and only A SQL Style Guide to bookmark.
How to track frontend interaction events in a scalable and usable way. These nitty-gritty events called “cta in navigation clicked” can pretty quickly get a lot of sisters and brothers and create an event structure that is hard to maintain and work with. Matty has published a good repository to start with a proper structure.
Investigate successful product features - Paul Levchuk chose a very data-driven way to build a measurement approach to investigate which features are adopted and used regularly.
📚 Weekend Longread
A gentle introduction to AI. Not too gentle. Don’t send it to your grandma.
Behind the scenes of the Instagram recommender backend just published by Meta. Read one of the largest recommendation systems on Instagram - Scaling the Instagram Explore recommendations system.
ML at Booking.com - With hundreds of ML models deployed in production, Booking.com teams share how they make it all work.
⛔ Hot Seat
Recent publications that made me raise an eyebrow.
- - Your guide to SaaS product metrics. This should be named as SaaS (product) marketing. Product metrics themselves are missing (they go beyond trials and activation). But PLG is mostly covered.
- - Analytics Team: Strategic Partner or Service Org? I (Olga) disagree that it’s right to mix professional skills with company structure and use one to justify or explain another. Most junior analysts start “serving” their product and business stakeholders. As they mature and develop, they learn how to influence them. Influencing is what makes us a partner and it comes with (a) experience (that leads to trust) and (b) better communication and ability to demonstrate ROI and impact. Org layout, role description, and timing are not as relevant.
- - How To Increase Your Price is nicely written, and some important points are addressed, but many vital things are missing. First, his model is relevant to the subscription business only. Second, any price change analysis has to include the ratio between monthly vs. annual. Higher price hits first for monthly subs. Annuals will get a hit (a) at a lower rate and (b) when they are up for renewal only. If your business has multiple subscription types such as weekly, 3 months, or 6 months, analysis becomes quite complex. Add trials to the mix. This is very important because that’s the input data for the LTV forecasting you do before the price change (which is missing in Reid tables). To add, be prepared that retention might not get as badly hit as trial-to-paid CVRs (if there are trials). By and large, price change analysis is difficult. It requires heavy BI expertise.
🎧 Podcast
Better Together podcast - Why experimentation is not a natural thing for product teams with
, Eppo.
Che brought up some interesting takes, especially about how data teams can better support the other teams. His recommendations about how to start as the first data person are valuable to me. Understand the company's current GTM strategy and growth model and you know which data you should focus on to support that.
Monday Morning data chat - The Rise and Importance of Business Language with John O’Gorman
Not the typical data nerd topic, but it's a topic that I come across all the time. How can you talk and work in a way where all people in a company will be on the same page? This is particularly essential for data teams, since they are dependent on other teams picking up their findings and generating business value.
📊 Monthly Chart Drop
Also, get inspired by stunning visuals and delivery from Berliner Morgenpost - Mapping where the earth will become uninhabitable.
❤️ Favorite publications this summer
Bookmarked or re-read favorite takes
Hightouch: You don't need the Modern Data Stack to get sh*t done
AI Supremacy : Top AI, Machine Learning, and Data Engineering Newsletters of 2023
Jim the AI Whisperer: Is ChatGPT getting dumber? Let’s talk about ‘AI Drift’
🍸 Drink and Mingle
Upcoming events, meetups, talks, and webinars.
Aug 31, online: Weekly Data Mesh Open Roundtable: Data Without Borders
Sep 6-8, San Mateo: SaaStr Annual 2023. It’s happening again. Gear up for thousands of founders and VCs from around the world flowing to the Bay Area once a year to drink, sell, pitch, and redefine SaaS.
Sep 12-14, online: Dreamforce 2023
Sep 14, online: WiDS Worldwide Virtual Conference
Sep 19-21, San Francisco: TechCrunch Disrupt
Sep 19-21, Miami: DSS: Using Generative AI & Machine Learning in the Enterprise
Sep 26-27, Dana Point: Code Conference
Sep 30, online: Web Technologies Program
Sep - Nov, online: ML⇄DB Seminar Series
Oct 16-19, San Diego, London, Sydney, and online: Coalesce 2023.
Oct 10-12, Chicago: DAA's OneConference
Thanks for reading, everyone!
Olga + Timo
 | A guest post by
|
This has some KILLER content. Thanks for taking the time to pull it together.
And you should totally still do vertical saas metrics. No one owns it! And you'll have a unique take compared to my finance view
What a treasure drove this issue is, fabulous stuff as always.