These Tricky A/B Tests Or Why Significance Matters - Issue 58
A recap of data analysis publications, guides, and news over the past month.
Hello analysts! I’m back with another edition of the Data Analysis Journal newsletter where I write about data analysis, data science, and business intelligence.
If you’re not a paid subscriber, here’s what you missed this month:
How To Develop Critical Thinking - how to approach problem-solving and develop critical and analytical thinking. A walk-through of different data analysis methods and techniques.
Advanced Analytics: Feature Engineering - how to extract and transform features for analysis or machine learning. The difference between feature engineering and feature construction. Ways to squeeze out the most value from a sparse or limited dataset.
A new SQL function - QUALIFY! And How To Optimize A Query Run Time - simple methods to optimize query cost and run time, an overview of indexes, and an introduction of a new SQL function. The explanation why window functions slow down query performance.
We are approaching the end of the summer, and many companies are already starting to think about planning Q4 projects and campaigns. This month, I was reminded of how tricky A/B tests can be and how you need to watch your back with statistics. I also rediscovered the sad reality of deficient BI tools dictating the data handling strategy. Ideally, there should be another way around, but the world is not perfect, nor is data management. Oh well.
🏆 Those Tricky A/B Tests
Today I wanted to bring up the A/B test topic again. I have a separate section in my journal dedicated to Experimentation, where I covered the fundamentals of the A/B test, reviewed some tricky cases, and cited common mistakes. But this is an endless topic, and no matter how many test analyses and rollouts experience you may already have, with A/B tests it’s never boring. You always can run into something new. Today, I will focus on one of the most common interview questions and a rather rare effect - early experimental data being wrong.
Have you ever wondered why you have to wait until the A/B test reaches significance? Why can’t you just stop the test once you see that Variant wins?
After reading this newsletter you will know how to answer that. However, depending on your audience, your answer can be different - from a detailed explanation of a hypothesis testing to a theory of chances. And all answers are correct. But the most relevant and appropriate answer is this: you shouldn’t stop the test early even if you think you see a clear winner because of regression to the mean.
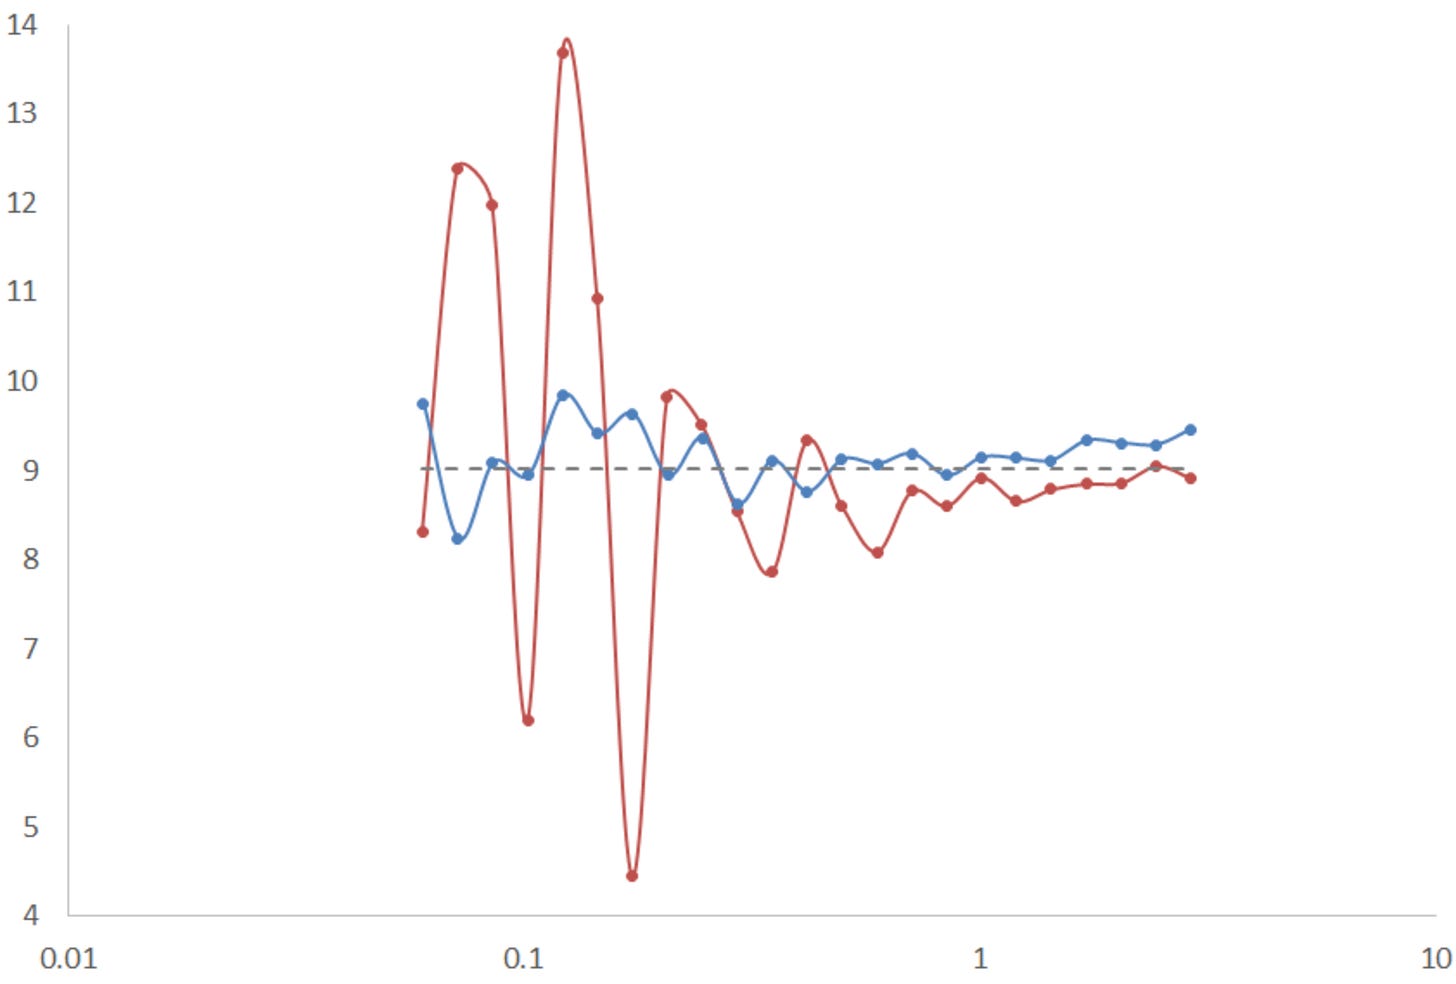
Regression to the mean (RTM) theory describes the false-positive result. Putting it into one simple sentence, it’s an effect when a variable is extreme at first but then moves closer to the average. In real life, the RTM conversion looks approximately like this:
From MakeTheBrainHappy - Regression To The Mean
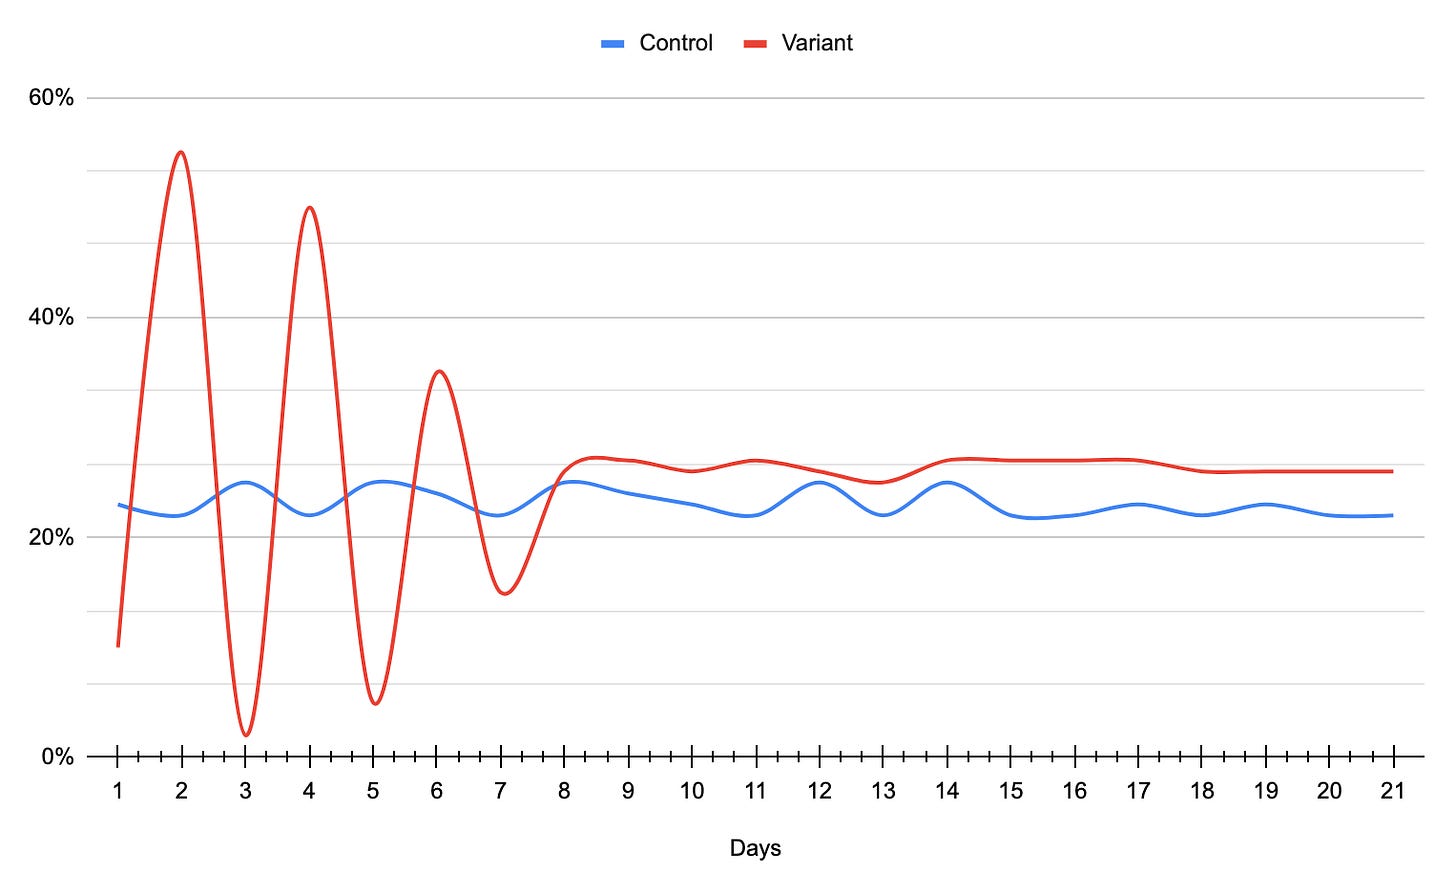
As you see, the Variant (in red) conversion is fluctuating significantly at first, but then normalizes and begins getting closer to the mean:
Other definitions of RTM I run into are “random measurement error” or “non-systemic fluctuations around the true mean”. RTM is quite tricky and makes the test data you receive look like a meaningful result (when it actually isn’t!). It becomes even more concerning when you accept it as a true test outcome and then run other tests against this “winning” group. And now you’ve ended up with multiple flawed tests. Good luck linking these “successful” tests to decreased or flat user growth.
Why does RTM occur? To simplify, you are likely to run into this effect when your samples are not randomly distributed, or the most common one, the experiment went through multiple rollout stages changing its size or variance. Also, the more properties (attributes) that the test events have, the higher the opportunity is for RTM.
How to prevent it? In truth, there is nothing you can do to completely eliminate the effect, but you can reduce the probability it will affect your test. Here are some basic common protection practices which you already know about:
Know your Baseline conversion. Ideally, measure it multiple times, know its range, and compare averages. This will help you identify if your Variant conversion is way off or suspiciously high or low.
Avoid running experiments on complex user groups that have many attributes. The more attributes you introduce, the more complex the experiment becomes.
The test groups should be randomized and normally distributed.
Avoid slow and disproportional rollouts. For example, once the test has been released to 10% traffic, do not reduce its size.
Don’t stop the test too early than estimated, even if it appears you reached significance or you have a clear winner/loser.
If you have to finish the test ASAP and don’t trust the results, you can run the analysis of co-variance ANCOVA (ANOVA+regression). It used to be easy to run in SPSS, SAS, Stata, or other old-world statistical packages, but now you can also run in Python Pandas.
In my experience, I’ve run into RTM only a few times out of hundreds of A/B tests. In 90% of cases, the early pattern you see stays and becomes more emerging throughout the test. Just don’t be careless with statistics and follow all the necessary steps and practices to ensure the testing effect you see didn’t happen by chance.
📈 Your Next Data Science Project
Free and Open Public Data Repositories.
If you want to add some spice to your portfolio, consider targeted mass killings analysis. The Atrocity Forecasting Project has developed and keeps updating a dataset of targeted mass killings. The dataset includes 207 targeted killings from 1946 to 2020 with each timing and location, targeted groups, type of perpetrator, intent, severity, and other aspects. Enjoy that uplifting information.
📊 Weekly Chart Drop
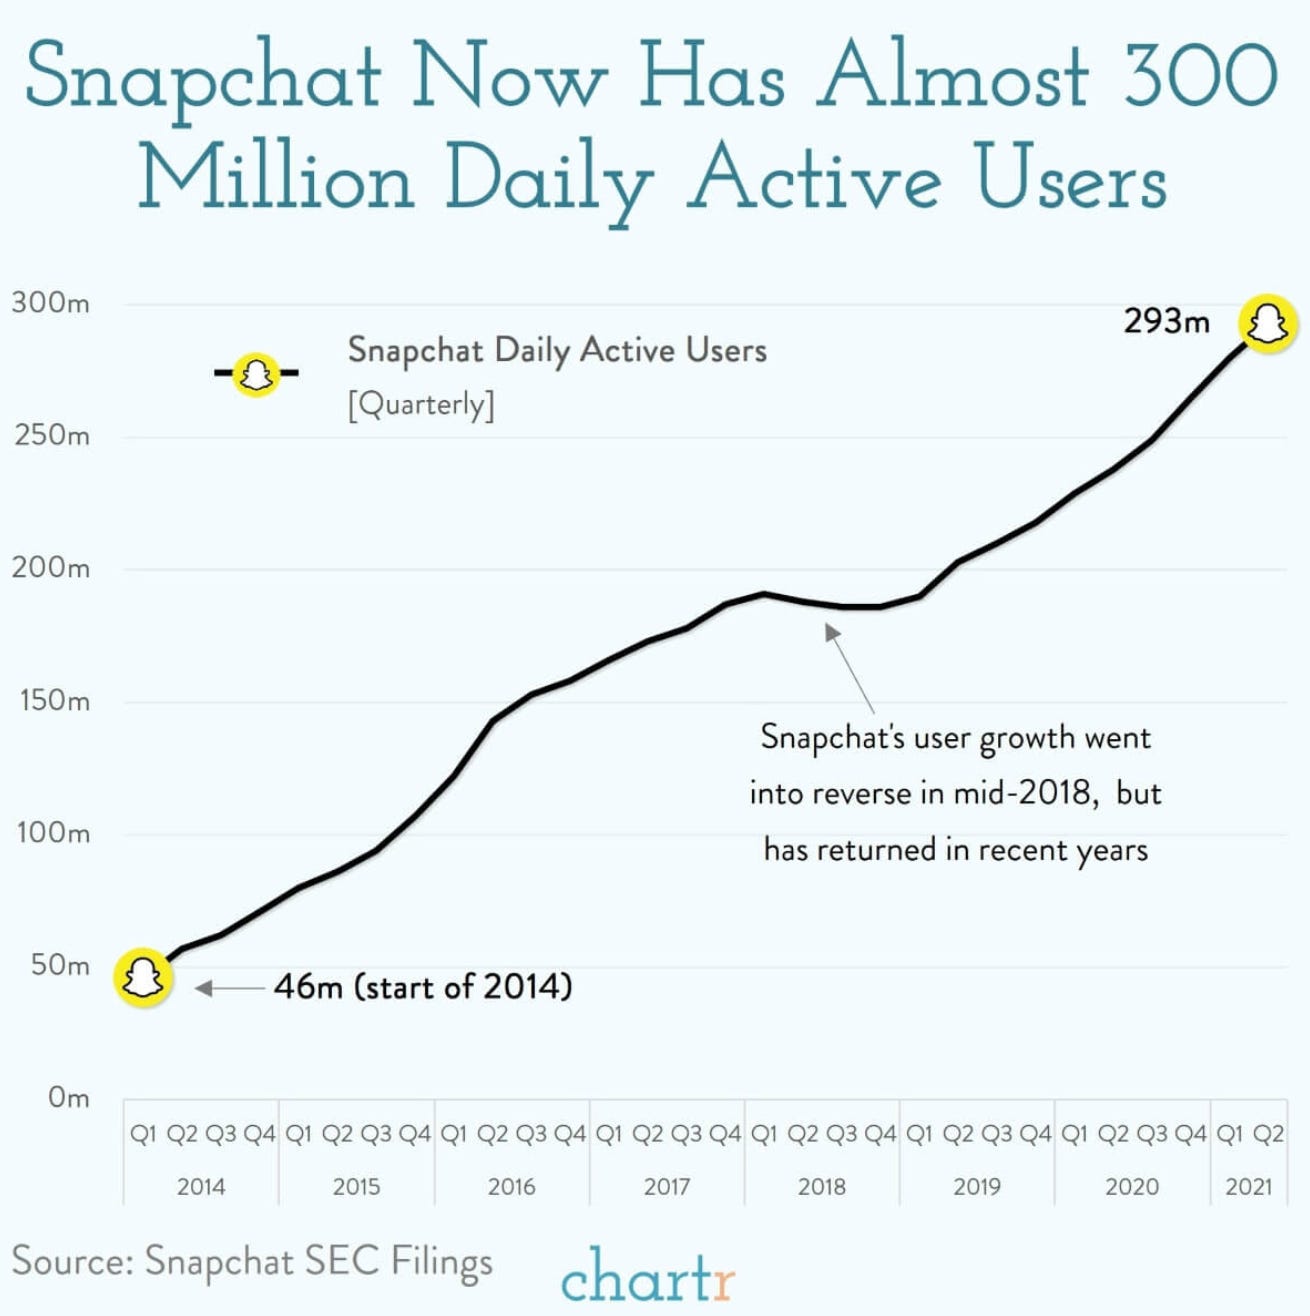
Snapchat recently announced hitting 300 million Daily Active Users. Quite a milestone. That makes me one of the 4% of people in the whole world who still don’t use it. Join the club!
🎧 Podcast
New interesting podcasts on data analysis.
Thanks for reading, everyone. Until next Wednesday!


