
How To Keep Improving Your SQL - Issue 33
A recap of data analysis publications, news, and tutorials over the past month.

Hello analysts, and welcome to a free-edition of the Data Analysis Journal newsletter, where I write about data analysis, data science, and business intelligence.
If you’re not a paid subscriber, here’s what you missed this month:
If you are considering supporting my journal, you can become a paid subscriber and receive:
Weekly SQL and Python interview questions, solutions, and guidance.
Deep dives and case studies.
Data analysis project examples and walkthroughs.
How to approach A/B tests, real-life scenarios, and implementation.
Insights from data analysts and data science experts who walk us behind the scenes of their daily work, discussing what challenges can exist and what knowledge they've taken from those experiences.
Interesting stories about how data affects people’s lives and how data analysts can make a change.
Additionally, paid subscriber questions and support are prioritized.
You can cancel anytime (and you can also expense this!)
$5 per month or $50 per year

February was a busy month full of interesting events, publications, interviews, and news. Below is a quick recap of data analysis news, events, publications, and updates from my journal.
🔥 What’s new this month
📕 Honored to be on the list of writers and announce the book release of Analytics Interpreted: A Compilation of Perspectives" - a curation of leadership, perspectives, and frameworks across the most relevant topics in analytics, such as data ethics, analysis, strategy, modeling, visualization techniques, case studies, etc. The ebook is available for purchase at Amazon (Kindle), and the paperback version will be available soon.
👤 A few months ago, I was interviewed for the Tech Girl Thursdays series run by UC Berkeley Data Science student, Shalini Kunapuli. We spoke about our experience, love, and pain of navigating through the sometimes-rough waters of data analysis. This week, I’m so excited to switch the role and interview Shalini for my journal to get her thoughts on common data challenges, skills, and Data Science internship projects at UpLift, LinkedIn, and Quizlet. Read her experience here on being an intern in Data Science startups and how to stay afloat in the sea of numbers.
👋 Ever wondered what a good rate is for app downloads? Clubhouse grew from over 3.5 million global downloads as of February 1, 2021, to reach 8.1 million by February 16, 2021. 4M downloads in 2 weeks is a damn good rate.
📺 Amazon has uploaded all of the sessions from its recent re:Invent conference to YouTube. The topics are about AWS databases and applications to store, process, and handle data and data pipelines. Some highlights:
🤝 For the last few years, I was part of the Women Who Code community whose mission is empowering women in technology. This month we are excited to launch WWCode Data Science Medium Blog. The first publication is about EDA and data preprocessing. Keep an eye out, because there’s more to come!
⏪ A Rewind Of Last Month
Paid Subscription Articles You May Have Missed
❗5 Mistakes To Avoid When Running A/B Tests
Read a thorough A/B test case deep dive about what to look for and what to avoid running tests.
Many companies today are very aggressive in running product tests. Some make testing part of their culture, and some simply use it as a security tool to validate new features. Regardless of the company mission, values, or roadmap agenda, as a data or product analyst, you have to ensure your team follows the right test principles, ethics, and statistical foundation.
☁️ Generating a Word Cloud In Python
The word or text clouds are very common tasks for analysts who work with textural, qualitative, or semantical data analysis. They are also common take-home assignments for candidates to test their knowledge of handling, processing, and visualizing text data. In this walkthrough, I showcase one of the ways to build a word cloud in Python.
📈How To Create Date Series in SQL
Let’s say you have a task to make a timeline of DAU (Daily Active Users) or users who purchased or subscribed daily. If your table contains only user clicks or purchases on a given day, you might not have date values when users did 0 activity or no conversion. However, you need to extract those dates for a consistent timeline or a series chart. In this publication, I demonstrate one method for generating time series in SQL.
🏆 Nailed It
Be prepared for your next interview
I said it before, the best way to practice SQL is in your local database. For this, you can install the PostgreSQL database and use the DataGrip client (free 30-day trial!) with it. This gives you the flexibility to design the schema the way you want and practice SQL from anywhere at any time. If you want to go a simpler route, use SQLFiddle or DB-Feddle tools. You can either paste your SQL there and polish the syntax or design your own table schema.
Today I wanted to share a roundup of recent interesting tutorials and publications on SQL.
If you are getting started with SQL, here are the best materials that I find easy to understand and practice:
For intermediate to advanced levels, here are interesting reads:
Reasons why SELECT * is bad for SQL performance - that’s a common interview question.
A Practical Use of the SQL COALESCE Function - I used a lot COALESCE especially for developing dashboards when you have to deal with NULL values. Highly recommend this approach.
Joining two tables that are not related by a foreign key relationship
4 Essential SQL Window Functions and Examples for a Data Scientist Interview in 2021
I also wanted to mention one of my favorite resources for learning SQL - {coding}Sight. It contains articles and tutorials for SQLserver and PostgreSQL dialects. Here are some of their recent walkthroughs:
If you are getting started with SQL Server, here is a good guide for walking you through how to install it, its terminology, fundamental concepts, usage, etc...
If you need more ideas or examples for interview questions and cases, check my post on SQL Interview Questions or read this amazing guide which has everything you need.
🎓 Level Up
Certifications, internships, schools, and courses.
WiMLDS Bay Area is launching a mentorship program. For the first iteration of the program, they are offering two cohorts (early career and mid-career) of mentees. All events in this program will be virtual. Duration: 3 months. Time commitment: ~2hr/month. Program Kick-off + Mentor-mentee mixer: Thursday, March 4, but you have to sign up now. Due to limited availability, the mentoring program will be first-come, first-serve, so hurry!
If you are working in SaaS, you might be interested in this new free Product-Led Growth Fundamentals Certification Course developed by Wes Bush (I interviewed Wes a few months ago to learn how to approach growth). This practical, no-fluff course will train you and your entire team on the basics of Product-Led Growth in less than 57 minutes.
Another Data Science free program is open now for the spring cohort - Correlation One. It’s aimed at diversifying the pool of underrepresented students and professionals in Data Science and AI, building a powerful network, and connecting with industry leaders - plus it is taught by professors from Harvard & MIT!
If you want to build your own portfolio, you can sign up for the ML Product Challenges workshop where you get to build products for various use cases (chosen from a few company-sponsored ones OR your own ideas). It is educational and fun, and you get hands-on experience working with real companies, and possibly win some prizes, too!
📚 Weekend Longread
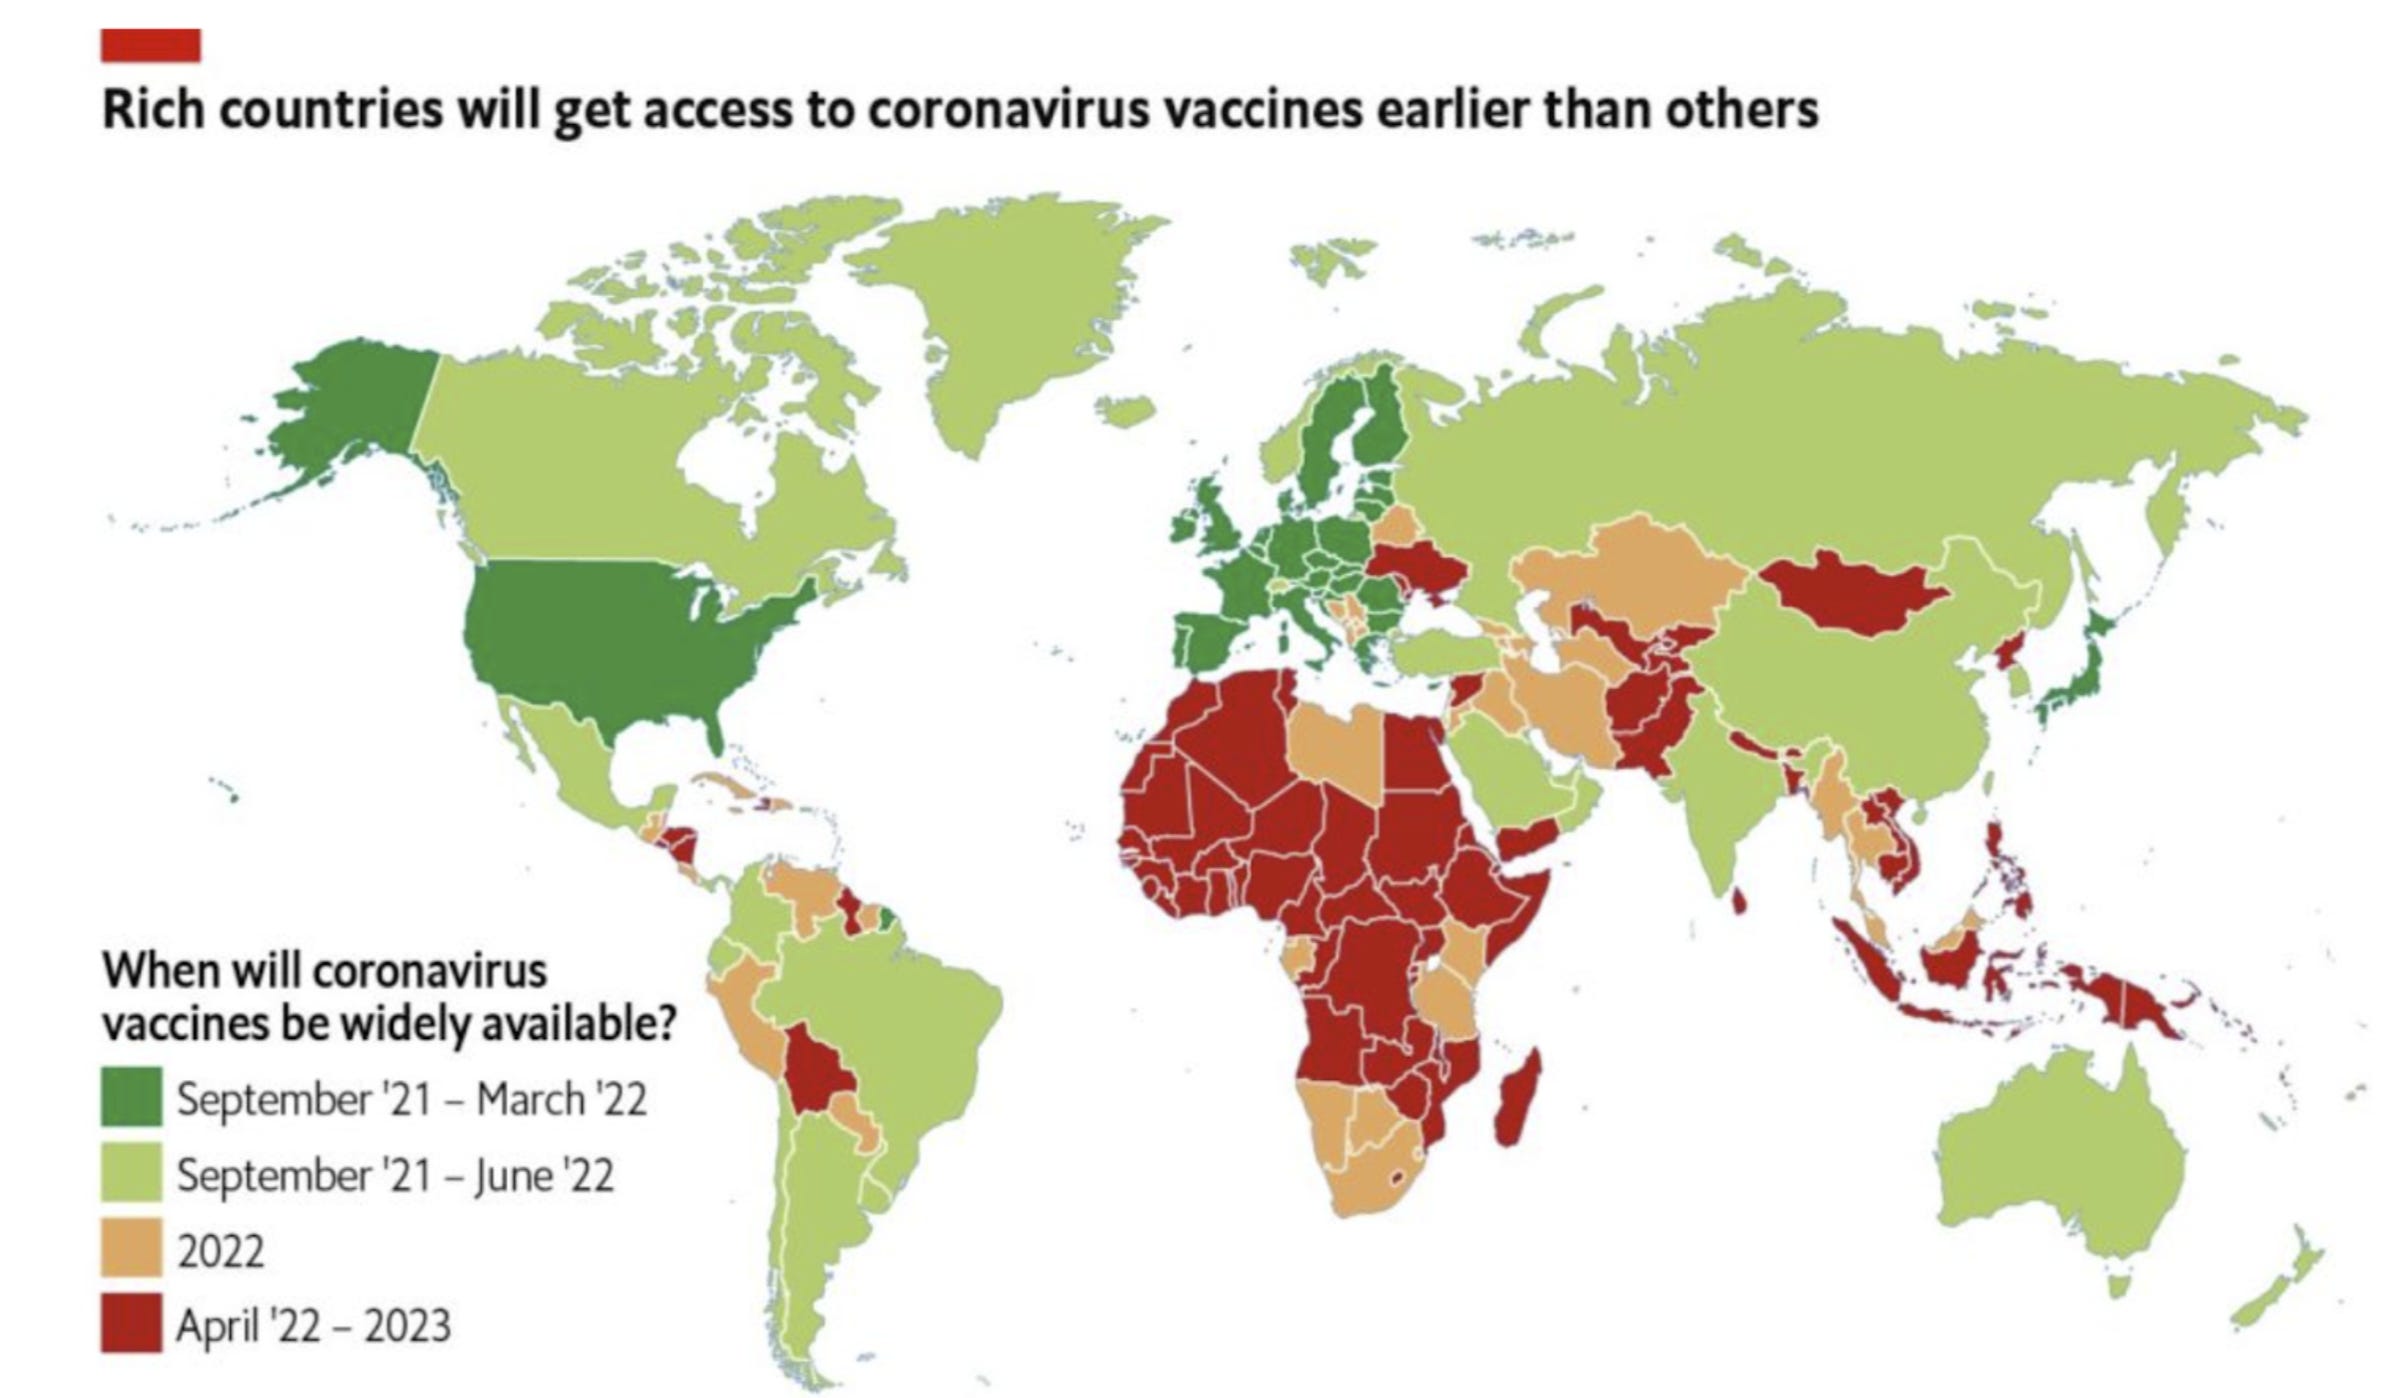
Charts and graphs can be tricky. It’s an art to showcase the data in the appropriate format that won’t misrepresent it. As a reader, you have to be even more careful how you perceive the data (especially medical research data). For example, vaccine trackers that focus on the cheery cumulative climb of the 'doses administered' curve tell an incomplete story. Check out these nine considerations when reading or creating charts of COVID-19 vaccination data.
🍸 Drink and Mingle
Upcoming free events, meetups, talk, and webinars.
Feb 25, GridDynamics: Talk to Your Data: Can AI Unlock BI?
Feb 25, Vera: Simplifying MLOps with Model Registry
Mar 1, Analyst? Engineer? Scientist? Roles in industry and startups
Mar 1, Galvanize: Intro to Python: Part 1
Mar 3, Galvanize: Intro to Python; Part 2
Mar 4, Galvamize: Intro to Pandas
Mar 9, KNIME: Intro to codeless deep learning
Mar 9, PyLadies: ML/DL Project Cluster
Mar 11, Math for DS Beginners: Workshop
Mar 15, DS on AWS
Mar 16, CloverDX: Deploying ETL into Cloud
Mar 25, YugabiteDB: How to Run Distributed SQL Databases on Kubernetes
Mar 31, PayPal: Recommendation Systems for B2B Companies


⚙️ Try It Out
It just might solve all of your problems
Simplql is an in-browser tool that lets you query data files with SQL without using a database. It does everything in the browser and doesn't upload your data files to the server. Users can export the results from their queries in CSV or JSON. Easy, fast, intuitive. Love it!
Thanks for reading, everyone. Until next Wednesday!