
January Digest: Stop A/B Testing… No, Do More! - Issue 244
Key updates and discussions in analytics over the past month

Welcome to my Data Analytics Journal, where I write about data science and analytics. This month, paid subscribers learned about:
Anticipating 2025: Top Trends in Analytics - What to expect in analytics from 2025.
Tableau vs. Power BI – Which Should You Choose? - A comparison of features, pricing, usability, learning curve, and dashboard examples to help you decide which tool to use.
Why Trial Success Rate Is the Hardest KPI To Report - My approach to calculating an accurate Trial-to-Paid rate, with examples and solutions for different trial-length conversions in weekly or monthly reports.
Today, I want to recap key updates and discussions in analytics over the past month. I’ve put together a collection of case studies and recent analyses you may have missed in January, along with upcoming events and new interesting publications.
But first, a few updates and reminders:
🗓️ Mark your calendars: I’ve compiled a list of the biggest data events happening this year to help you plan ahead - The Biggest Data Science and Analytics Conferences in 2025. Let me know if I missed anything.
📊 Meet you in Amsterdam on June 16th at the Worlds Data Science conference!
Every year, data scientists and ML enthusiasts gather in Amsterdam for a few days of networking, research, awards, and collaboration. After Snowflake and Databricks events in San Francisco, consider heading to Europe for a week of data science in Amsterdam!
🔥 Free DatacGrip licence! If you’re looking for the best IDE for databases in SQL and NoSQL, I have 1-year DataGrip license to share! They’re not paying me to say this, but after trying nearly all of them, I can confidently say that DataGrip is the best IDE for analytics. It lets you organize SQL and notebooks, maintain version controls, and integrate with GitHub and dbt. I love it, and as a courtesy, they’ve offered my readers a few annual business licenses - so let me know if you’d like to try one!
🔊 Advocating for analytics
Avinash: “Stop A/B testing. Few investments today are a worse use of time, people, money.”
Ron Kohavi: “This is inaccurate in many ways. In some sense, it is a call to stop doing bad A/B testing.”
Here’s my favorite thing about Ron Kohavi - whenever he feels challenged, he responds with a sort of white paper 💣. His point is that, when properly used, controlled experiments have driven incredible progress. Yes, when properly used.
Please don’t tell Ron, but many products out there don’t invest in proper experimentation, and they test everything. Inaccurately. Some test without even having a hypothesis or available measurements. Given that this is the case for many (if not most), should we advocate for less [flawed] testing?
I am with Avinash on this one - throw your eggs.
🔥 January highlights in analytics
Reforge acquired Monterey.ai to launch Reforge Insight Analytics, aimed at helping product teams work with qualitative data. The team believes (a) it’s time to shift focus from quantitative to qualitative insights, (b) working with qualitative data can be overwhelming, and existing tools for this are not good, and (c ) for AI, qualitative data is more important than ever. So now, Reforge aims to solve this gap.
ChartMogul posted the latest SaaS benchmarks for January 2025, highlighting that for B2B and SaaS companies, retention remained flat or negative, with most growth driven by new customers.
Google Sheets now supports Gemini! Last week, Google introduced the ability to generate insights from data using Gemini and transform them into visual graphs, which can be added directly to Google Sheets as static images over cells.
Tableau announced the 10 runner-ups for the Best Data Visualization of the Year. The winner will be revealed at their annual conference in San Diego this April. Reminder: Chris Westlake’s scatterplot won in 2024. Scatterplots are seriously underrated.
📚 Weekend Longread
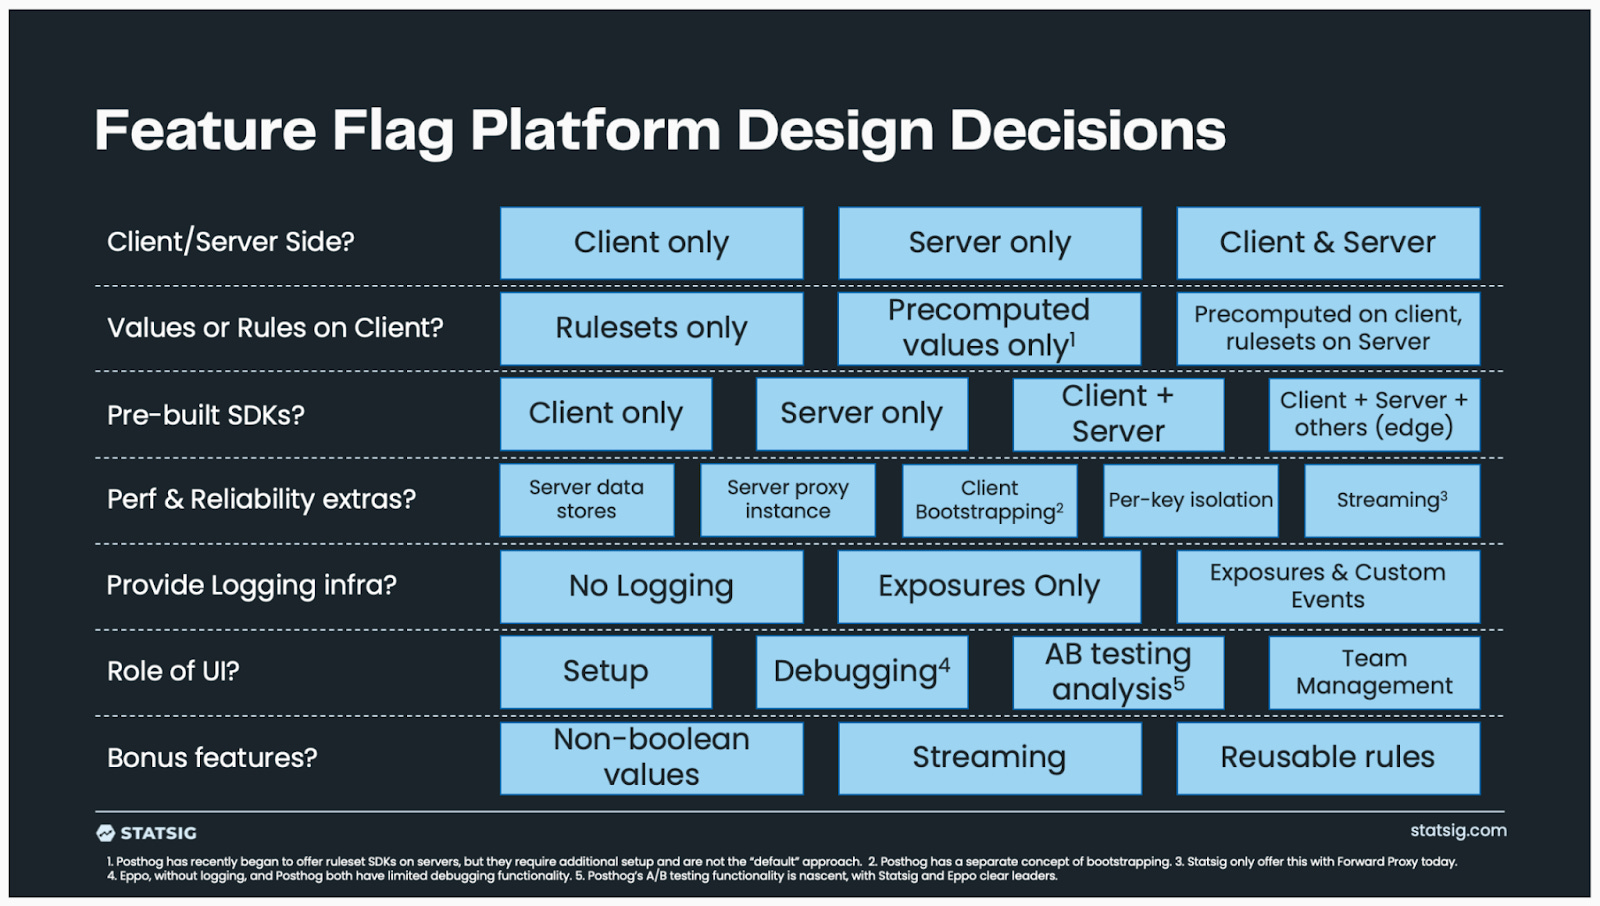
A great guide from Statsig - The ultimate guide to building an internal feature flagging system is also a good introduction to feature flagging, ways of working with feature flags, how they are different from a database, how to handle user targeting, how to design flags, and more.
⚙️Know your craft
Materialization of Data Warehouse Layers from Hands-On Data. Learn the difference between views and tables and the concept of execution time.
An Introduction into Unstructured Data from Generative Value.
Need a tool to make a diagram or a metrics tree? Use this - Data Stack Diagram.
Anomaly Detection in ML Using Python and Anomaly Detection in Time Series
Stats 101 — A Visual Guide - Never learned A/B testing? A gentle introduction to statistics, testing, and distributions from Convert.
Making maps with R. And also Making art with R very cool.
Mastering your Data Stack — Part 4: Building Your Dashboards from Metabase.
Why Less Events Lead to Better Analytics from Timo, who migrated from Substack to Ghost. Should I do the same…
The top 21 metrics for startups to track from Mixpanel.
What metrics do Marketplace companies report on? From Mostly metrics.
TMAI #443: Customer Powered Hyper Growth C-Suite KPIs from Avinash.
A Playbook for User Retention from Heap.
🤓 Analysis and case studies
How Uber is Saving 140,000 Hours Each Month Using Text-to-SQL and also MySQL at Uber.
Data at LinkedIn: Buyer journey insights with data-driven attribution.
Is Data Science a Good Career in 2025?
“According to U.S. News & World Report, data scientists ranked among the top jobs in 2025 for both pay and demand… The U.S. Bureau of Labor Statistics predicts a 36% growth in data scientist jobs from 2023 to 2033—much faster than the average for all occupations. As businesses adopt more data-driven strategies, the need for skilled data professionals will continue to rise. Companies are constantly finding new methods for analyzing, visualizing, and interpreting data, which requires experts to manage these processes.”
❤️ Favorite publications this month
Bookmarked to re-read favorite takes
Shaping 2024 with Data: A Year of Data Visualizations on Tableau Public.
Top 10 Data Engineering & AI Trends for 2025 from Monte Carlo.
5 Key Predictions for the Data Industry in 2025 from SeattleDataGuy.
How to Make Everyone Great at Data from Harvard Business Review.
Storage is cheap, but not thinking about logging is expensive from Randy Au, who also moved from Substack in January 🤔.
⭐ Bare Necessities of Data Management from Crystal Lewis:
“There are so many data management practices that can help you better organize your project, yet a team’s ability to “do it all” is really limited by factors such as funding, timing, team size, and expertise…. So, if you need to prioritize a small list of practices to start implementing right away, what should those practices be?” Amazing piece on how to do it all.
Thanks for reading, everyone!
Hey can you give me the DataGrip licence? I need to try it! Thanks.