
Spring Digest: Building Data Culture With Metric Trees
Case studies, analyses, and new tutorials and books you may have missed.


Hello, everyone! Timo and I are back to advocate for analytics and entertain you with data updates in product and data science in this (hopefully) short spring recap.
We’ve compiled some of the case studies, recent analyses, tutorials, and books you may have missed, along with events and new interesting publications.
🔊 Advocating for analytics
Peter Fishman in Advancing Your Career in Data and Analytics:
“...While the tools were always important and did speed up the analyst work, the bulk of the work is to understand the business context and opportunities, and we haven’t gotten much better as a profession at that. We’ve focused on speeding up our own technical output, assuming (possibly incorrectly) that we’re already capable of the first.”
Christophe Blefari at MDS Fest:
“BI tools are graveyards… Notebooks have changed the way we explore data. Data can be shared the notebook-way but dashboards are as dead as Excel.
Analysts aren’t just chart builders. Stop building dashboard(s). Build BI apps instead.”
🔥 Spring highlights
Spring was busy with many events, including Data Council 2024, MDS Fest 3.0, Data Universe 2024, Split Flagship 2024, Stripe Sessions 2024, and others. Here are some of the recent highlights in analytics we wanted to recap:
Product marketing analysts can sigh in relief, but not for long. Google has delayed the phase-out of cookies until 2025.
A few months ago, Tableau announced the finalists for its 2024 Iron Viz competition to find the best data storyteller. One thing Tableau excels at is community engagement - with 196 contestants from around the world submitting their stunning dashboards for a chance to win a $15,000 prize. I am truly fascinated by the creativity displayed in most contestants' work. I highly recommend checking it out.
Remember when I predicted that notebooks will overtake analytics? Well, meet one more new notebook tool just released - Pretzel! This open-source, offline browser-based tool was designed for fast and intuitive data exploration and visualization, can handle large data files, runs locally in your browser, and requires no backend setup. However, using notebooks for writing and operating production data pipelines? I never saw that coming.
Google introduced Croissant: a metadata format for ML-ready datasets. This easy-to-use, standardized shared data format will now be supported by Kaggle, HuggingFace, and OpenML. Croissant aims to make ML development easier and faster.
📚 Know your craft
Metrics library - There are more useless metric collections than useful ones - but this one is really well done.
Top 6 Tools to Turn Code into Beautiful Diagrams - Diagrams can help with documentation or planning and bring many people on the same level.
Why Marginal ROAS Matters and How to Measure It - How to evaluate the efficiency of marketing efforts and ad campaigns (Return On Ad Spend).
Using GA4 with BigQuery for Product Analytics - No one likes to work on the very opinionated initial GA4 model. This post explains how to transform the data into a useful state.
TMAI #406: You Are Doing ROI Wrong -P1 - Another great deep dive from Avinash Kaushik.
The Hidden Looker Costs - This is a great guide to understanding your Looker Dashboard usage and BigQuery costs.
Patterns and anti-patterns of data analysis reuse - “A speed-run through four stages of data analysis reuse, to the end game you probably guessed was coming.“
Smoke tests vs. Regression tests - A write-up from Split explaining the difference between smoke and regression tests and where feature flags come into play.
How we solved RevenueCat’s biggest challenges on data ingestion into Snowflake.
Machine Unlearning in 2024 - To simplify, “unlearning” involves removing the knowledge acquired by an ML model or “forgetting” certain patterns the model has learned over time.
What does a confidence interval mean? - a new publication from one and only Allen Downey.
Applied ML for Tabular Data - a practical guide to developing quality predictive models from tabular data.
Technical Learning at Lyft: Build a Strong Data Science Team.
🌟 Expert Spotlight
Today, Timo and I are featuring Abhi Sivasailam, CEO and Founder at Levers Labs, and his famous Metric Trees. Those familiar with analytic trends likely know Abhi and his work, as he is a vocal advocate for data culture and data-driven growth. Below are some of his notable recent talks:
and publications:
Timo: Abhi’s Metrics Tree board is my favorite, covering the essentials for SaaS revenue. His initiative brought metric trees into the spotlight and reignited their use.
Recently, Abhi shared his awesome B2B SaaS Metrics Canvas with MRR metric trees for us to borrow, which includes all aspects of MRR growth: Net New MRR, Retention, Churn, Expansion, Contraction, and Resurrection:
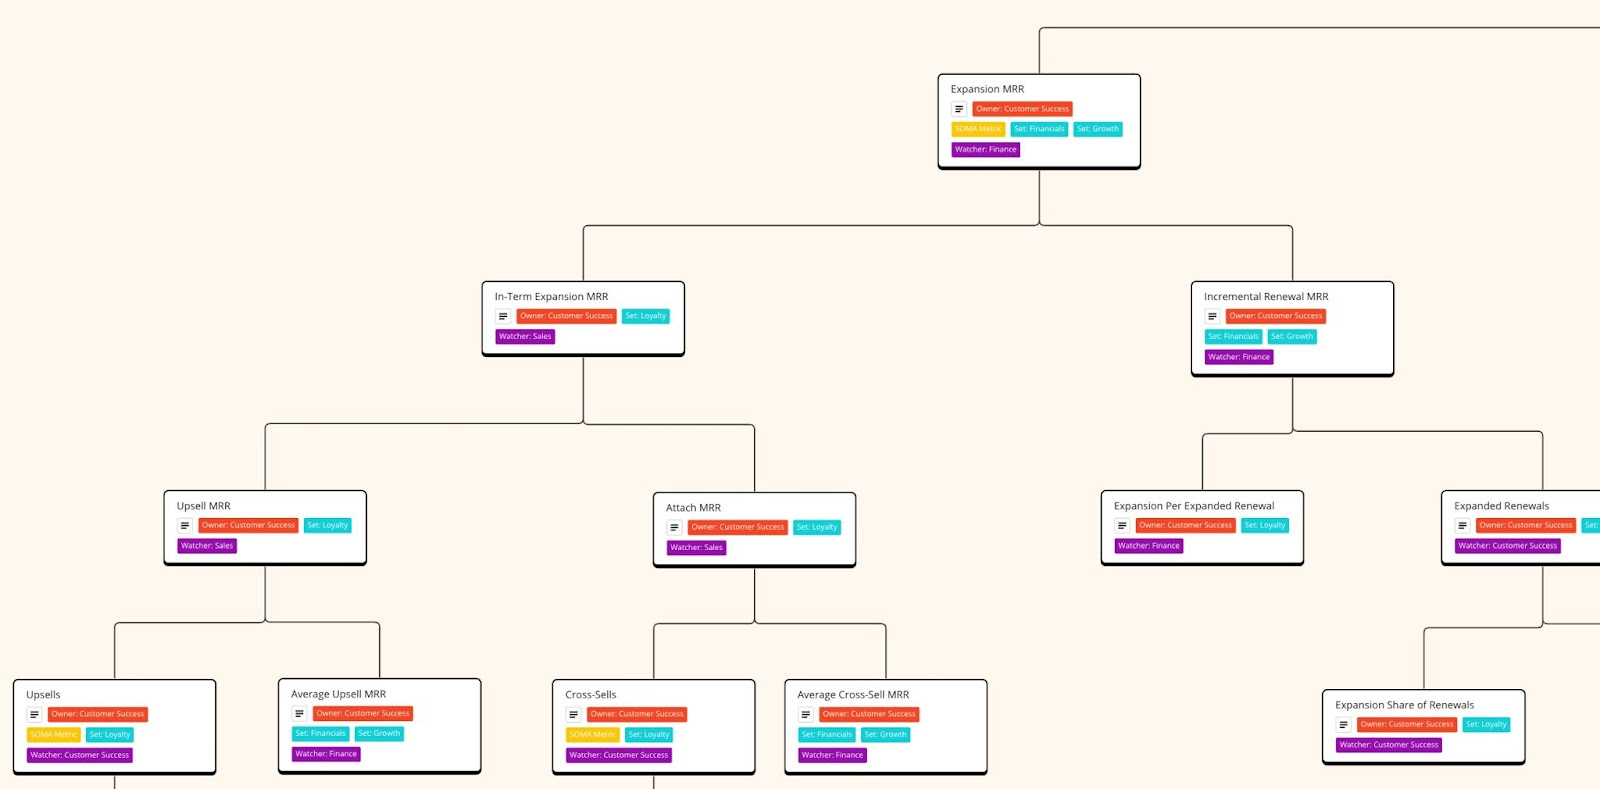
This ready-to-use framework is based on the SOMA approach, an open-sourced Standard Operating Metrics & Analytics system. It simplifies the process for companies to define, create, and work with operating metrics.
Olga: It takes me some time to fully appreciate metrics trees. On one hand, I value Abhi’s emphasis on the importance of precise measurements and his efforts to quantify them. I also agree that, fundamentally, it boils down to an input → output system.
On the other hand, I find the practice of locking definitions and assigning metrics into static, predefined structures somewhat restricting. From my experience, reporting rarely unfolds as planned. Every company has its unique fingerprint on how it translates values from input into metric output. Accurately calculating metrics like LTV or ARPC often requires unexpected adjustments, including altering variables or components. As a company grows, these metrics must also evolve and adapt.
That being said, Metric Trees provide a logical representation of a growth model and serve as an excellent mission statement for data teams. They are a powerful tool for bridging data engineering with business, which is a common challenge. Metric trees are also effective at root cause analysis. They also lay a strong foundation for ML and forecasting. From this perspective, they are practical, and I’d recommend adopting them as a framework.
⛔ Hot Seat
Recent publications that made us raise an eyebrow.
The modern measurement playbook: How to optimize your marketing effectiveness and fuel growth from Google:
Timo: Let’s call this one a warm seat: When people with a clear monetary interest publish playbooks - you should be highly careful what to do with them. This one by Google is actually not that bad and has some good things in it - but always keep in mind what Google makes their money with.
3 ways to maximize ROI by 30%+ from GrowthInsider's Newsletter
Olga: Every few weeks, the authors of this newsletter (representing Houzz) publish examples of actual experiments and product changes that claim to improve conversions. After going through a few of their publications, here is what I find surprising:
Every experiment reportedly results in significant lifts (e.g., “20% increase in day 7 retention,” “20% increase in Free Trial conversion,” “Conversion rate and GMV increased by 15% adding $10s of million in additional revenue for Variant B,”…), which I find hard to believe. Unless you work with small data sets.
Most success metrics used in their publications are very high-level, for example, “Free Trial conversion.” Do they mean Signup-To-Trial, Install-to-Trial, View-to-Trial? Subscription trial?
I like how they use a structured framework: Problem → Experiment → Impact → Learning, which is easy to follow. However, so much important context and nuance is omitted - such as test setup, targeting, duration, baselines, business model, references, etc, making it impractical and possibly misleading.
📈 New industry reports and benchmarks
ChartMogul’s April Benchmark 2024 - registration is required now to access benchmarks on ChartMogul. Here is a summary.
🎓 Tutorials
Transform Your Data Stack with dbt - 10 days, $650 running by Madison Mae
Storytelling with data - 8-week course, $1,895
PySpark Course: Big Data Handling with Python and Apache Spark - 1 hour on YouTube
Diffusion Models Course - free on Hugging Face
📗 New books:
Applied Causal Inference Powered by ML and AI - An introduction to the emerging fusion of machine learning and causal inference.
Machine Learning Q and AI: 30 Essential Questions and Answers on Machine Learning and AI - a book recommended by AI Supremacy .
📈 If you missed our spring publications:
From Data Analysis Journal:
From timo's substack:
🍸 Drink and Mingle
Upcoming events, meetups, talks, and webinars.
May 7, San Francisco: Airbyte and Dagster: Modern Data Infrastructure
May 8, Portland: DCCWest
May 8-9, Boston: Data Summit 2024
May 15-17, Amsterdam: World Data Summit
May 14, Seattle: Women in Data Science Puget Sound Conference
May 14-15, online: dbt Cloud Launch Showcase
May 16, Mountain View: dbt Labs and Snowflake: Bay Area Data Leader Series
May 16, online: Influx Data: Unleash the Full Potential of Your Time Series Data
June 3-6, San Francisco: Snowflake Summit
June 5-6, Santa Clara: AI & Big Data Expo
June 10-13, San Francisco: Databricks Data and AI Summit 2024
June 11-13, virtual: Posette: An Event for Postgres 2024
June 14, GB: Research and Applied AI Summit
June 18, NY: DSS: Applying AI & ML to finance & tech
Thanks for reading, everyone!
Olga + Timo
Previous Recaps:
 | A guest post by
|