
Summer Recap: The Analytics Startup That Couldn’t - Issue 270
Your monthly recap of the latest trends, market shifts, key discussions, and updates in data science and analytics

Welcome to my Data Analytics Journal, where I write about data science and analytics.
This month, paid subscribers learned about:
Significance Level vs. Statistical Power in A/B Testing - A refresher on the 4 core concepts: significance level, confidence level, statistical power, and confidence interval. How to tell them apart, understand what they mean, and what the expected benchmarks are.
Causal Inference Methods for Bridging Experiments and Strategic Impact - Lessons from Roblox: How to attribute business growth to product launches, or generalize experiment outcomes to broader populations.
Re-Subscribers: Are Your Customers Coming Back? - How to locate and query re-subscribers, segment them, and interpret re-subscriber rates and milestones. How to interpret, analyze, and report returning customers.
❇️ 🆕 New: I also launched a Sunday Q&A section to answer your questions, follow up on notes, and share your stories. The first issue: Sunday Q&A: Maven Classes, Analytical Thinking, and Best BI Tool
Between traveling and changing time zones, I’ve fallen behind, but here’s what I bookmarked to re-read, noted, or learned this month.
🔊 Advocating for analytics: The long (and sad) story of June
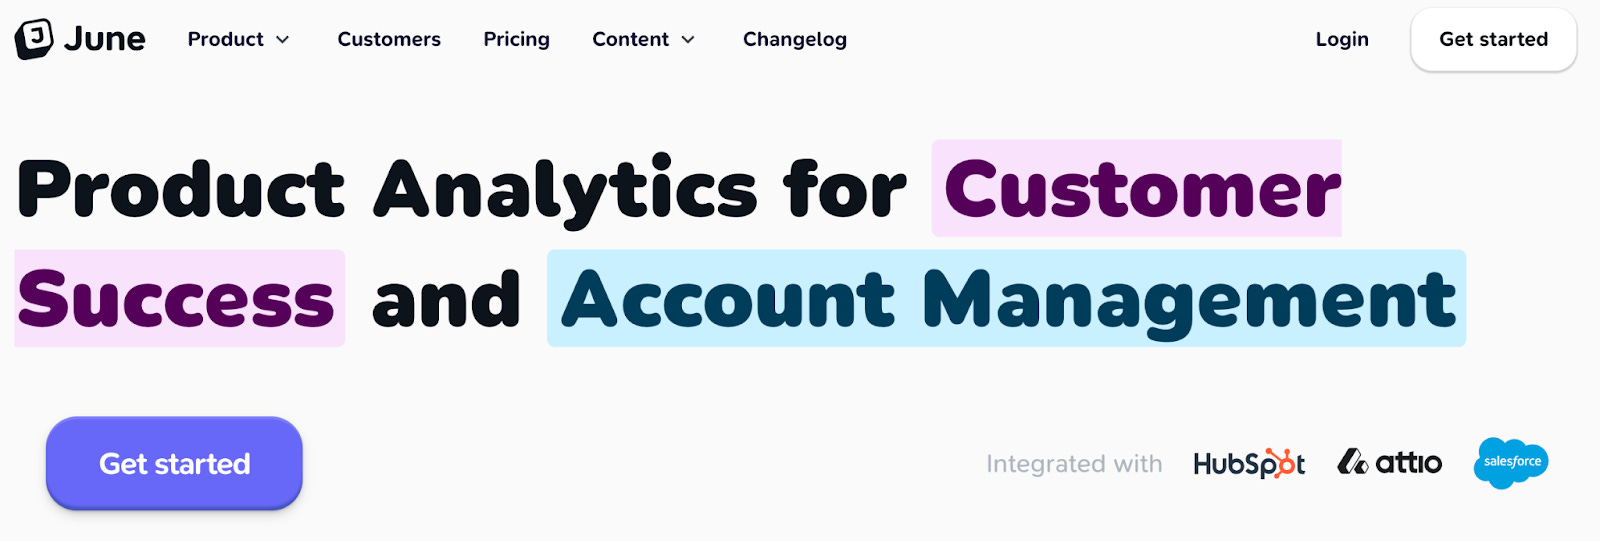
Expected (by some) news this month that June.so is shutting down. Its small founding team is hired by Amplitude.
I’ve been following June's journey closely since 2021. I didn’t believe in the future of its analytics, but I was still surprised by how it was failing - despite a $2M pre-seed investment, the YC network and support, TechCrunch PR, Product Hunt leaderboard, a Golden Kitty Awards, incentivized reviews, and partnership promotions…
I decided to share June's story as an opportunity to advocate for analytics and to highlight just how important it is to truly know your craft.
The story: 2 talented kids, Enzo and Ferruccio, who had previously worked together at Intercom, founded June with the goal of “making it easy to set up dashboards for your most important product metrics.” They joined the YC batch in 2021 and positioned June as an analytics template layer on top of Segment. The product had nice templates and a fun UI with emojis. But they were building an analytics platform without a deep understanding of what analytics actually is. None of the founders had a background or experience in data analytics, finance, or statistics. Still, it was apparently enough to raise a seed round.
“After a year of building our product we tried to monetise and failed. Our free users weren’t willing to pay us money for individual reports”.
To add, the market was (and still is) heavily dominated by Amplitude and Mixpanel. So June had to reposition itself. And it did, many times:
First, it was “a simple product analytics for startups.” Then it became “product analytics for B2B and SaaS.” Later, when 1K June users (!) didn’t translate into scalable paid customer growth, they pivoted from analytics to customer success, where I actually thought they had a shot at dominating. But then they announced: “We’re expanding to build a 360° customer platform”... and I was running out of popcorn.
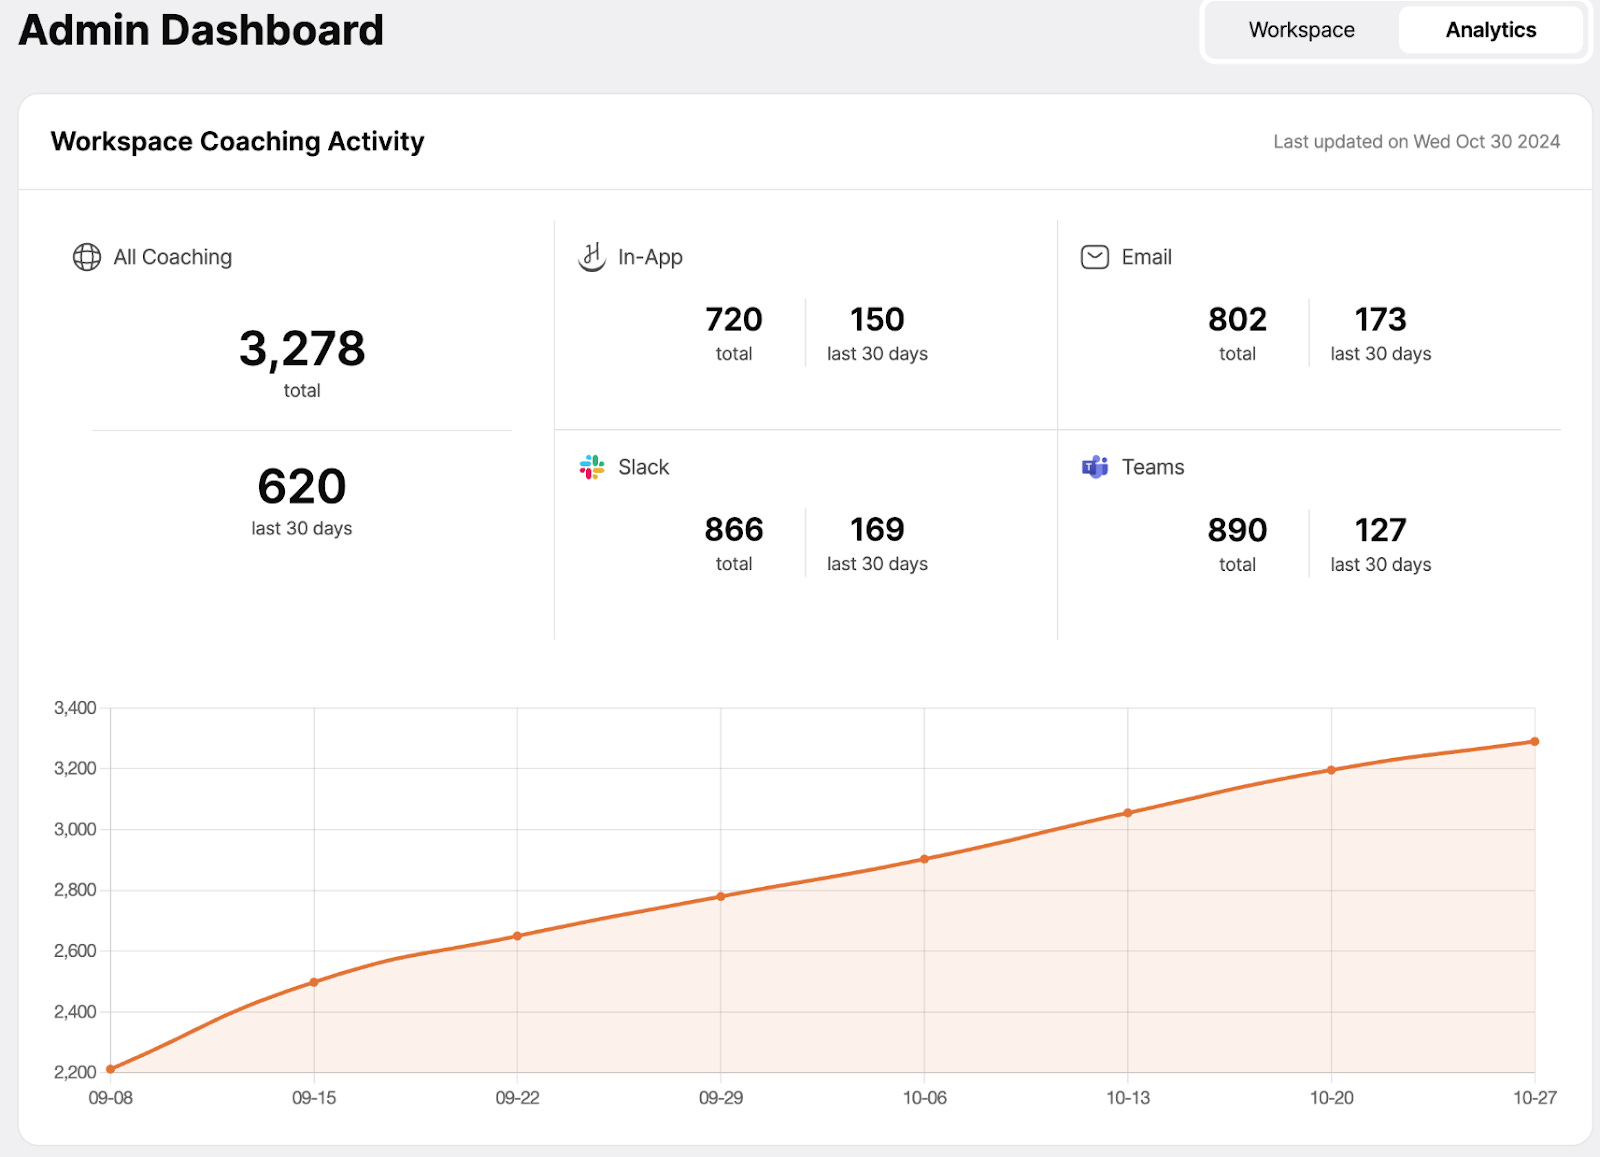
Every Enzo-influencer post was about product management or product challenges. Never about actual analytics (maybe I took that personally?), often accompanied by graphs that were... I wouldn’t say bad, but certainly neither accurate nor appropriate. You know… the kind of thing a PM might create between the meetings, not a data analyst for a report. Which is completely fine, unless you're building an analytics platform for a thousand orgs.
There’s been speculation about why June shut down, pointing to tough competition and a small team. Probably true. But what we should really take away from this is that it’s never been easy to turn raw event data, the kind June was ingesting to “make metrics”, into output that actually serves the business.
Especially when it comes to analytics for B2B SaaS:
It requires analytics with needle-level precision. But precision and reporting accuracy are the opposite of raw event data. Remember, product analysts work with low-trust data. They use different frameworks to read and interpret it. And a specific approach to model it. Even experienced analysts struggle with this.
It also requires granular reporting on revenue dynamics - expansion, contraction, and movements between plans. Event or session-level data with a static user status simply doesn’t cut it. No one expects revenue reporting from Google Analytics. We expect it from Stripe. Such reporting requires direct integrations with all payment providers and mapping out financial data to event streams. Very expensive.
User-level reporting alone is not enough. B2B/SaaS needs segmentation at the org level, team-level, division-level, and role-level, and metrics aggregated across all of those dimensions. Event-based systems, by default, aren’t built for that kind of hierarchy.
There are ways to address and solve all of this, but what they tried to achieve is hard. Amplitude and Mixpanel do not do it well, with all their scale and resources.
I just wish June’s investors had recognized the complexity of the space and brought in people with analytics experience to join the founding team. There is real demand for tools like this, and we need proper solutions for SaaS and B2B analytics that go beyond ChartMogul revenue reports or Stripe dashboards. June could’ve been that cool, indie-alternative in the product analytics world, with its own community of operators we could learn and be inspired by. 😔💔
Let’s see if Equals is next.
📈 New industry reports and benchmarks
The SaaS Go-To-Market Report from ChartMogul.
The State of Data and AI Engineering 2025 - from lakeFS.
Leading AI models benchmarks from Kaggle.
⚙️ Know your craft
The biggest misconception about web-to-app funnels (and why it’s costing you money) - from RevenueCat.
Attract New Customers Without Alienating Your Old Ones - HBR.
The Art of Business Analysis Part 1 and Part 2 from Data Patterns
There Are Many Roads to Machine Learning - from The Palindrome
How to Get Foreign Keys Horribly Wrong (in Django) from Haki Benita
“The First Data Hire” Series: How to Survive and Succeed as a Solo Data Leader from SeattleDataGuy
👋 Join New Community
I wanted to give a shoutout to a new (well, not so new) and fast-growing community of analysts - GOATs Community. When I started my newsletter, there weren’t any public groups or channels for analytics (that I knew of), so I am always excited to support a space where analysts can connect, network, and grow by exchanging ideas and insights.
📚 Weekend Longread
The Three-Body Problem of Data: Why Analytics, Decisions, & Ops Never Align
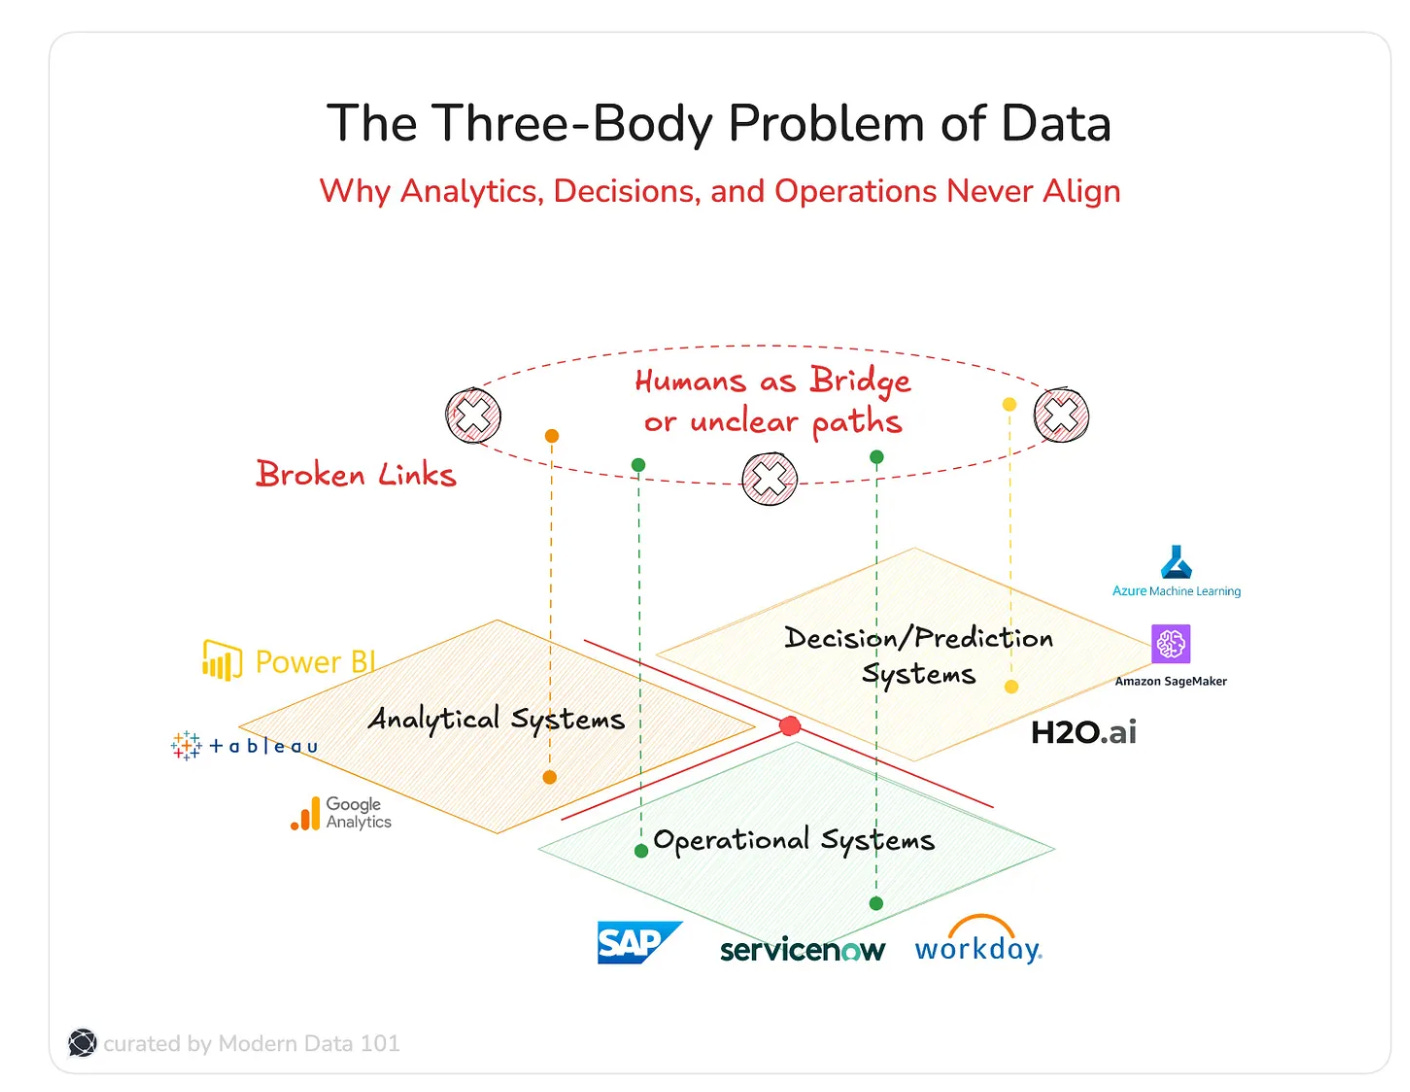
“Most systems aren’t broken. They’re worse: they almost work. As a veteran salesforce user the first thing you do is download as Excel and operate from there. Two people will slice PowerBI data differently and land on entirely different insights. Then, the ML system makes a prediction: demand will rise, a device is at risk, an order will likely fail. And the prediction is not wrong.
But by the time someone actually does something about it, it’s already irrelevant.Ops teams continue in their world, raising tickets in ServiceNow, responding to issues that surfaced three days ago. Everyone’s working hard. Everyone’s acting on something. But they’re never acting on the same thing, or at the right time within the necessary window.”
🤓 Analysis and case studies
Bears Will Be Boys - A data analysis of animal gender in children’s books.
Investors have poured $1B into Experimentation this past year. Here's why.
The Metric Tree Trap - How simple math obscures more than it reveals.
🎓 Tutorials
Learn SQL - Metabase, a BI platform, launched a free SQL tutorial - learn how to work with dates, do aggregations, filtering, and debugging.
ETL Course - Dagster, a data platform, announced a new ETL tutorial - a free 7-lesson course.
ML Models Visualized - ML algorithms from first principles.
Copy the Pros: How to Recreate this NYTimes Chart in R - a step-by-step video showing how to replicate a vertical bar chart in R.
❤️ Favorite publications this month
Bookmarked to re-read favorite takes
Thanks for reading, everyone!
Interesting read as always! The June.so story is a cautionary tale, and you've hit the nail on the head with the importance of truly understanding the craft of analytics, especially in the B2B SaaS space. It's not enough to just build a pretty UI and offer templates; you need a deep understanding of the underlying data and the specific needs of the users.
I think one of the biggest challenges for these analytics startups is the complexity of B2B data. It's not just about tracking user events; it's about understanding org-level dynamics, revenue streams, and all the nuances of the customer journey. That requires a level of precision and granularity that's often missing in these off-the-shelf solutions.
I'm also curious to see what happens with Equals. They're tackling a different problem, but they're still operating in a very crowded and competitive space. It'll be interesting to see if they can differentiate themselves and build a sustainable business.
Thanks for sharing your insights.
Still trying to figure out, in part by reading your articles, what I really am. Am I really an analyst or a PM, or DBA, or DE, or...? So far it seems to be a mix.
Thank you for your newsletter. Good content. Truly appreciate you posting the occasional freebie for us starving students (jkjk)