Your Favorite BI Tool - Issue 198
A roundup of popular BI dashboarding tools to help you choose the best reporting tool.
Welcome to my Data Analytics Journal, where I write about data science and analytics.
This month, paid subscribers learned about:
Subscriptions reporting: Trials and TTP - A deep dive into trials analytics. Learn about different types of trials and the dynamics of freemium vs. reverse trials. Trials reporting from RevenueCat, Recurly, Stripe, Chargebee, and ChartMogul.
Outliers: To Drop or Not to Drop? - How to detect outliers and what to do with them. Why, in some cases, outliers are harmful and should be removed, and in others, they must be retained in your dataset to make your analysis or model more precise and accurate.
How To Find Optimal Proxy Metrics - Why core business KPIs aren’t suitable for A/B tests and how to select the appropriate proxy metric for measuring product rollouts or feature optimization.
A few years ago, I published Ditch Tableau For God’s Sake. It’s 2021. Afterward, I received many questions about Tableau alternatives - if Tableau is so bad, then what BI tool is a good alternative?
I didn’t have an answer ready, as my initially favorite BI tool was sold to Atlassian and subsequently shut down, and then my next favorite tool was sold to Sisense and transformed into something else.
I used Tableau at MyFitnessPal and hadn't explored other dashboards until last week, when I began testing other options that the BI market has to offer.
Honestly, I was blown away.
While I was stuck with Tableau for the last few years, trying to figure out which was worse - the slow online version with limited features or the desktop version crashing every few hours - meanwhile, the BI market accelerated with progressive tools like Rill Data, Sigma, Zenlytic, Omni, CorralData, and many others.
So today, I want to share my overview of popular BI platforms, including their pros and cons. I have years of experience with some of these dashboarding tools, while others I have only started testing more recently. My main objective is to showcase objectively and unbiasedly what analytics offer today from the perspective of an analyst who is responsible for developing, maintaining, and distributing data insights.
To ensure this list is constructive and comprehensive, I asked a few of my good analyst friends to share their experiences and perspectives on the BI dashboarding tools (otherwise, it would be just another Tableau-is-so-behind vent). Well, it didn’t go well, as many reviews aligned on how slow and behind (and expensive!) Tableau is. So, I decided to leverage the community of a thousand Data Angels to get their perspective. I am grateful many jumped in to help me put together a balanced, fair, and practical list of popular BI tools 🙏.
If your team is looking for a better dashboarding tool, this publication will hopefully be helpful. If not, join me in contemplating what the best analytics tool should be.
Before we dive in, I differentiate static dashboarding BI tools (e.g., Power BI, Tableau, Looker) from:
Digital web/mobile dynamic analytics platforms (e.g., Mixpanel, Amplitude, GA, Heap)
Notebooks (e.g., Hex, Deepnote, Querybook, etc.)
A new generation spreadsheet (e.g., Arcwise, Equals, RowZero)
Real-time data "observation" monitoring tools (e.g., Monte Carlo, Graphana, Firebase).
While all these data platforms overlap, the use cases and applications are very different.
In this publication, I will discuss dashboarding BI reporting tools that let you create “classic” KPI dashboards. In one of my next publications, I will focus on other flavors of analytics (notebooks and spreadsheets).
Without further ado, let’s review Domo, Sisence, Tableau, Looker, PowerBI, Sigma, Rill Data, Metabase, Superset, and Omni broken down by features we love and things that don't work.
Looker
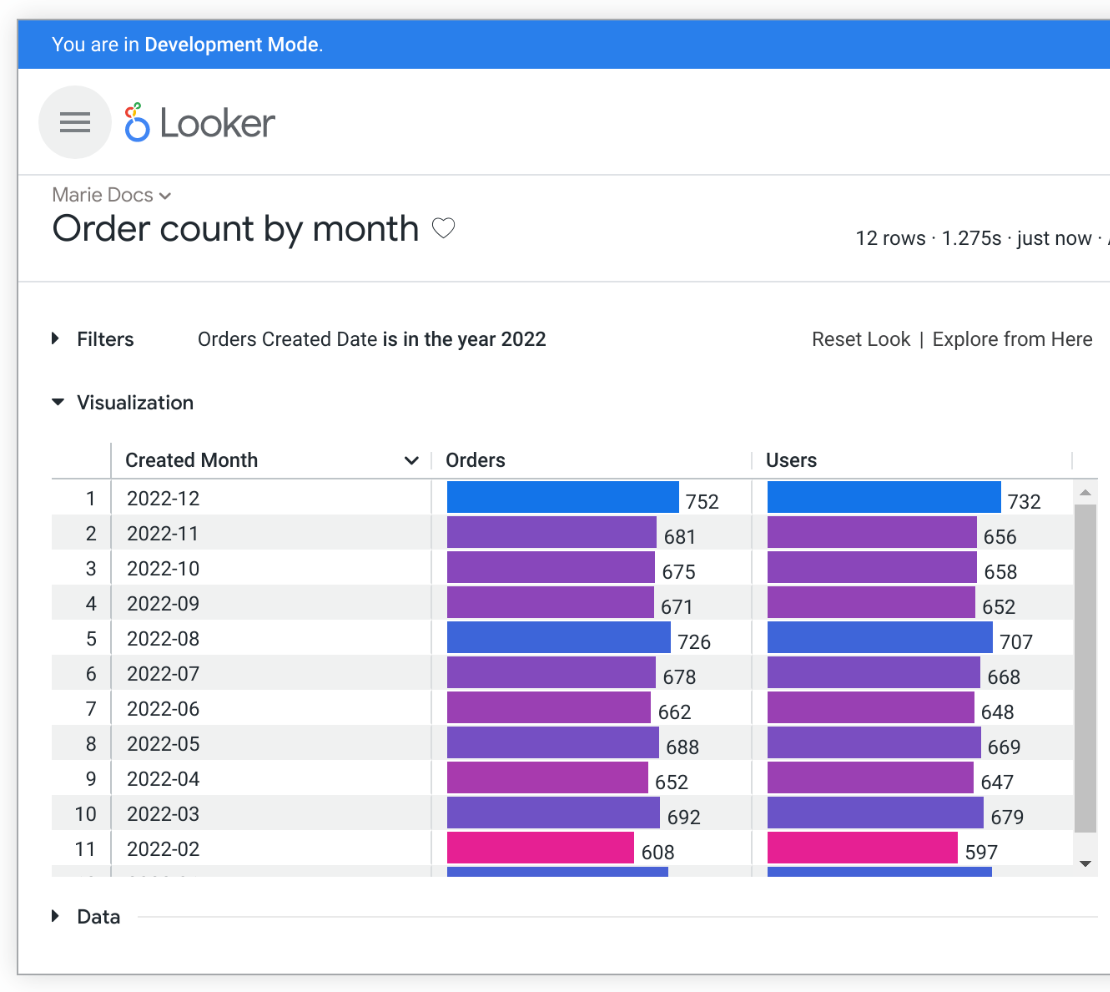
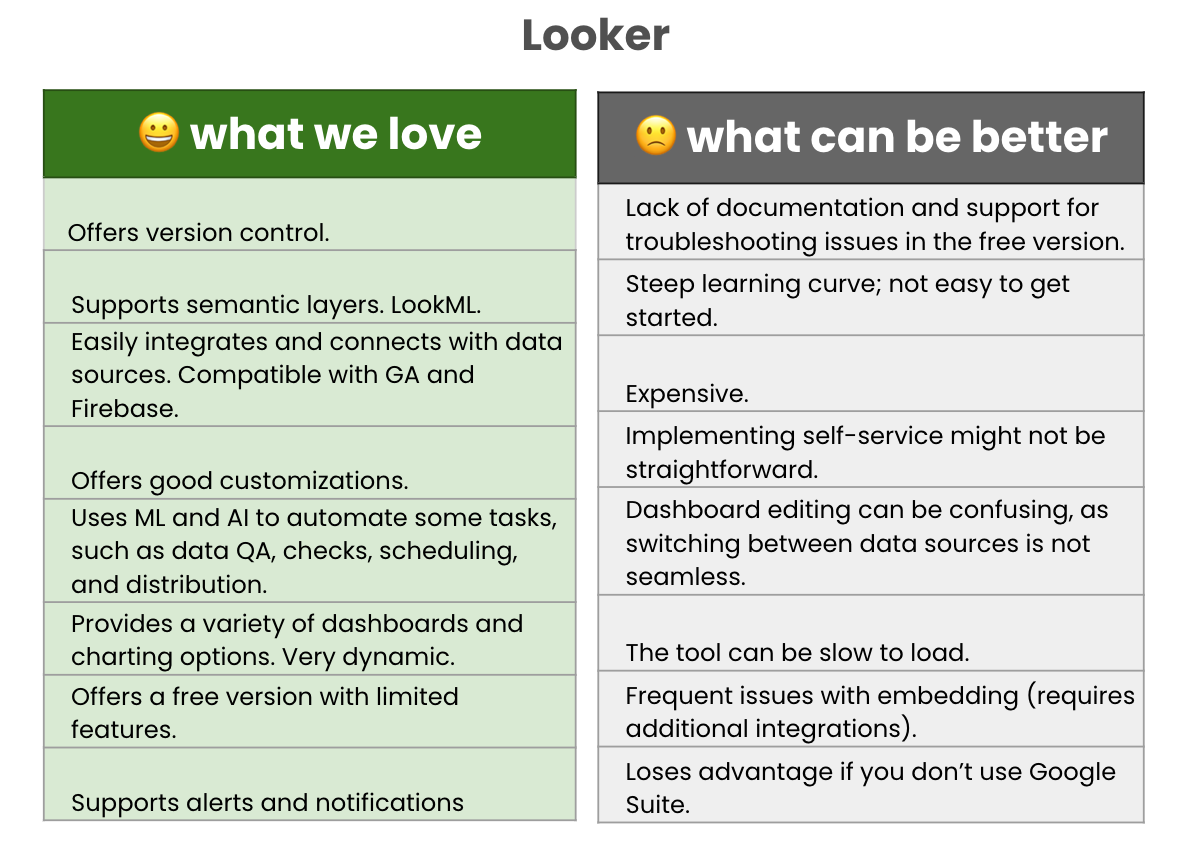
I've noticed that people either love or hate Looker. Although I'm not a big fan, I think it's worth it if you can afford its premium features. I last used Looker 4 years ago, so I'm not well-acquainted with their latest features. That being said, back then, adopting Looker for our data science team was the best decision and my most positive experience with team workflow and insight delivery. Our team became very efficient. We could support each other in creating and designing dashboards, take over or pick up each other's work, document, and structure reports, and the support from Looker was outstanding. I believe it is also the only BI tool that offers version control.
Tableau
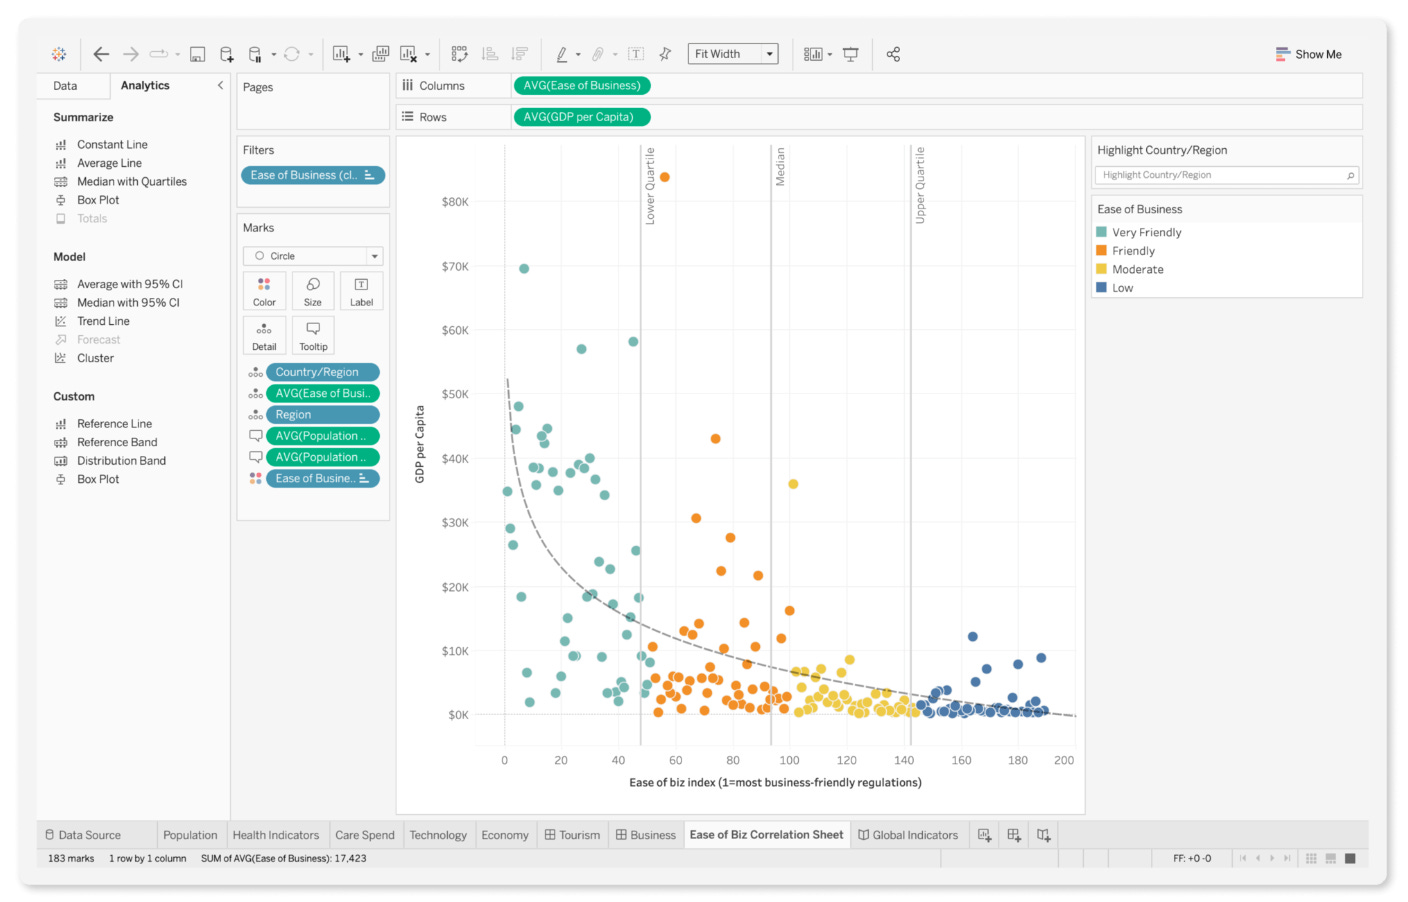
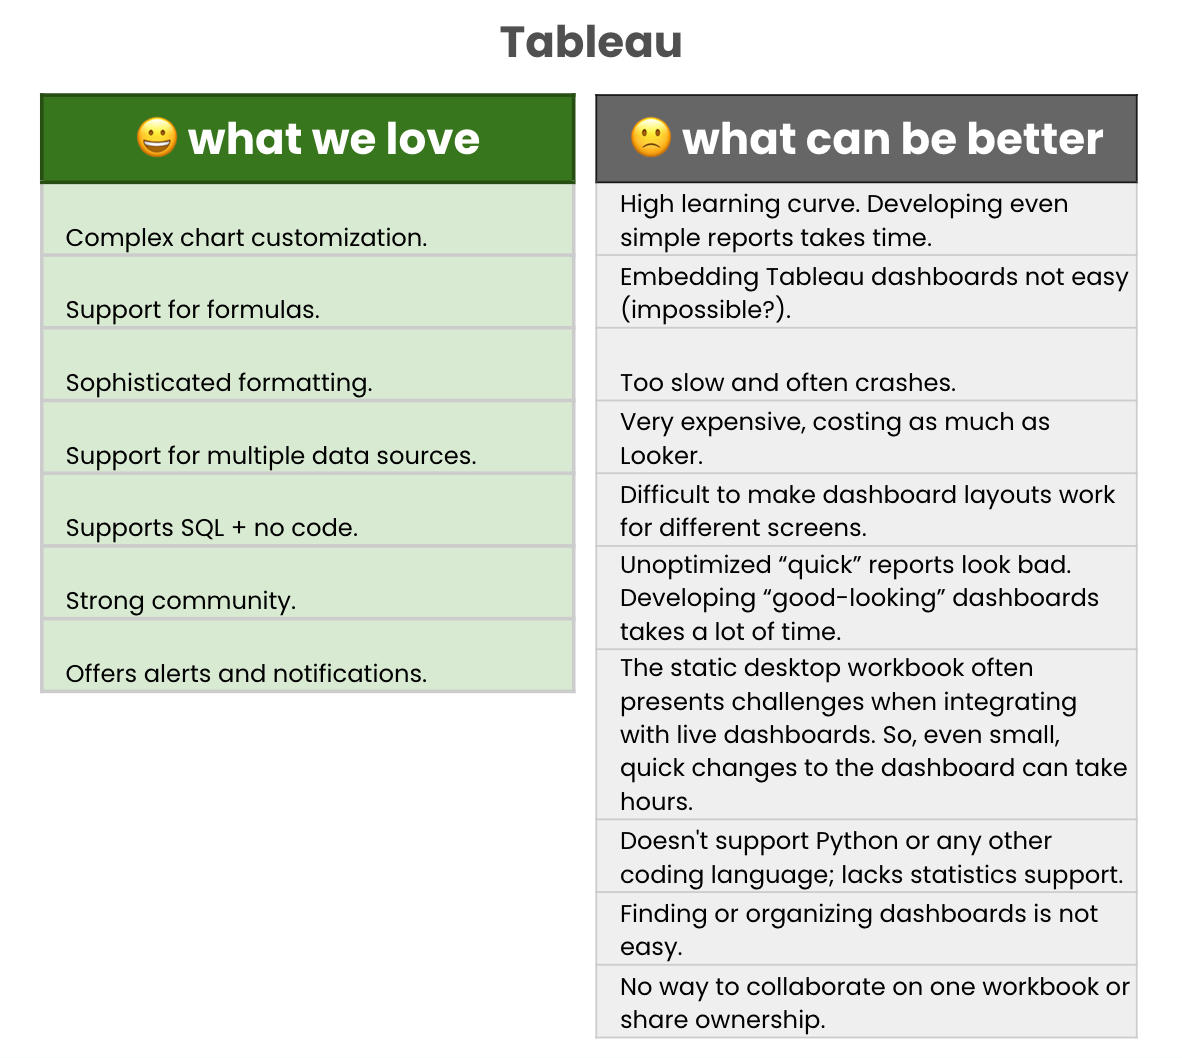
As much as I dislike Tableau, to be fair, it is one of the only tools on the market (along with Looker and Power BI) that allows you to build a report with complex customizations, intricate formulas, and sophisticated formatting. Whether it's adjusting YoY with a weighted average for the 3 summer months or calculating the % of lost transactions over the first 2 weeks against total transactions - whatever your CFO requested after yesterday’s happy hour - Tableau can handle this. Yes, you will spend many hours figuring it out and possibly hating your job, but not many other tools offer this capability for edge cases.
However, unless you work at the US Department of Defense, which has over 2 million employees and time-to-value is not the top priority, adopting Tableau might not be the most sensible choice.
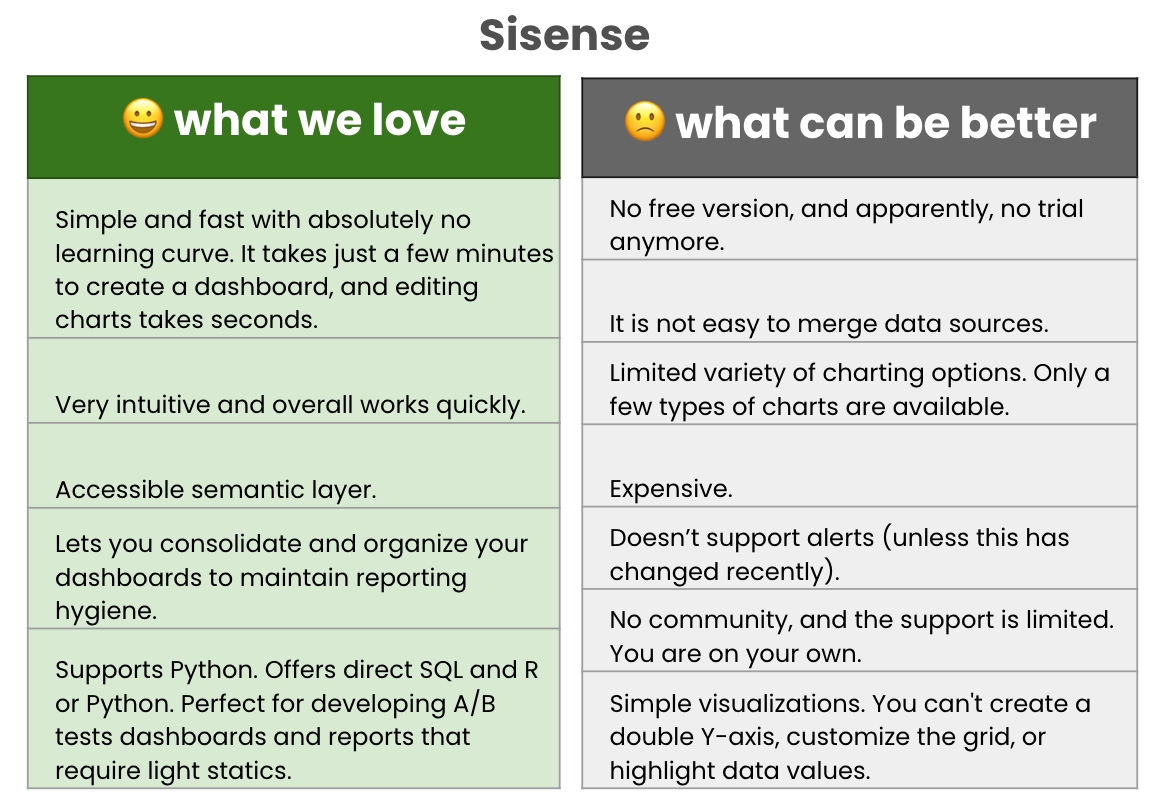
Sisense
I have had a positive experience with Sisense. I used it for a year and would recommend it. While some functionality may be limited when addressing edge cases or complex formatting, the overall onboarding time, scalability, and maintenance offer a good compromise.
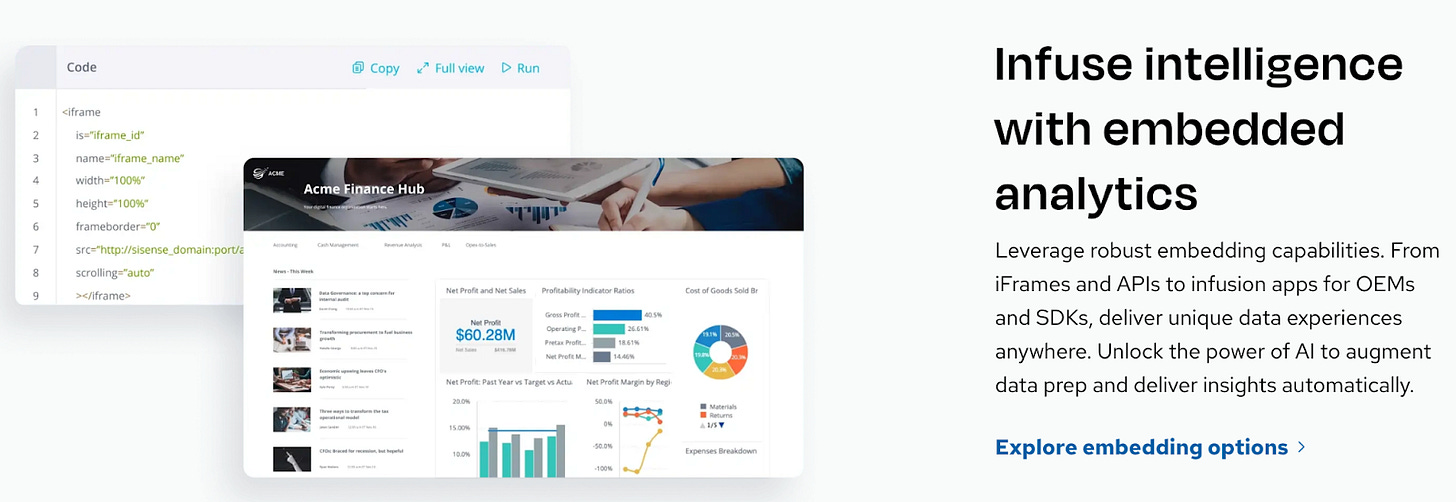
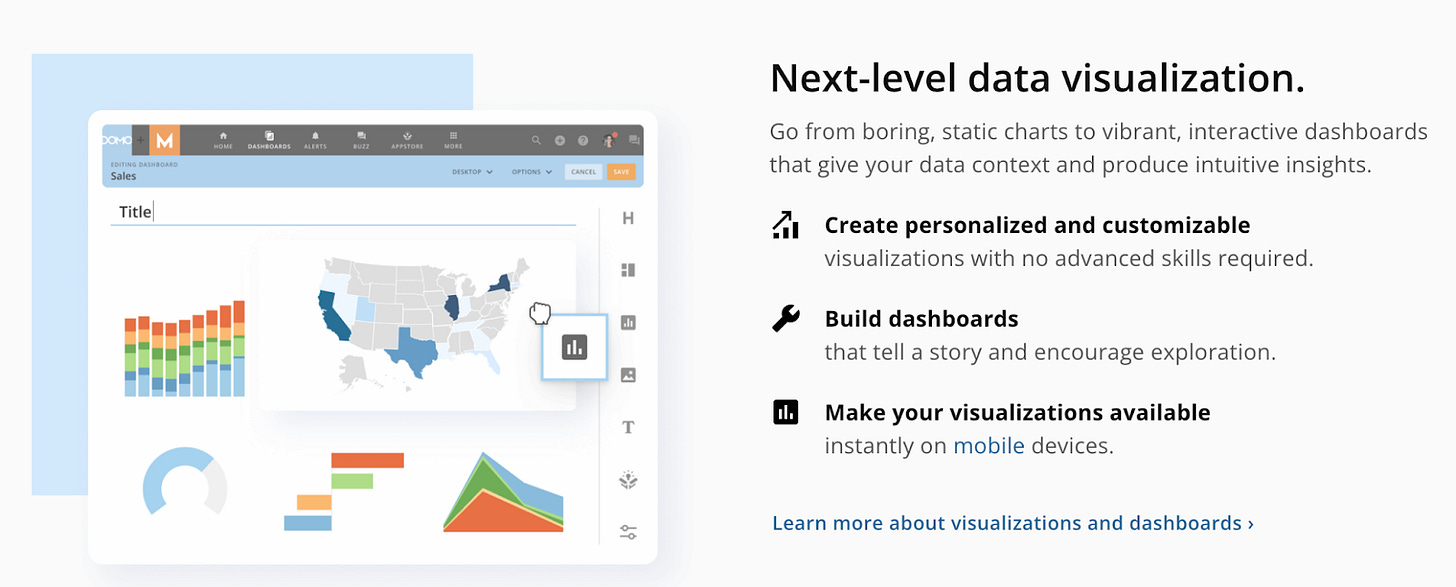
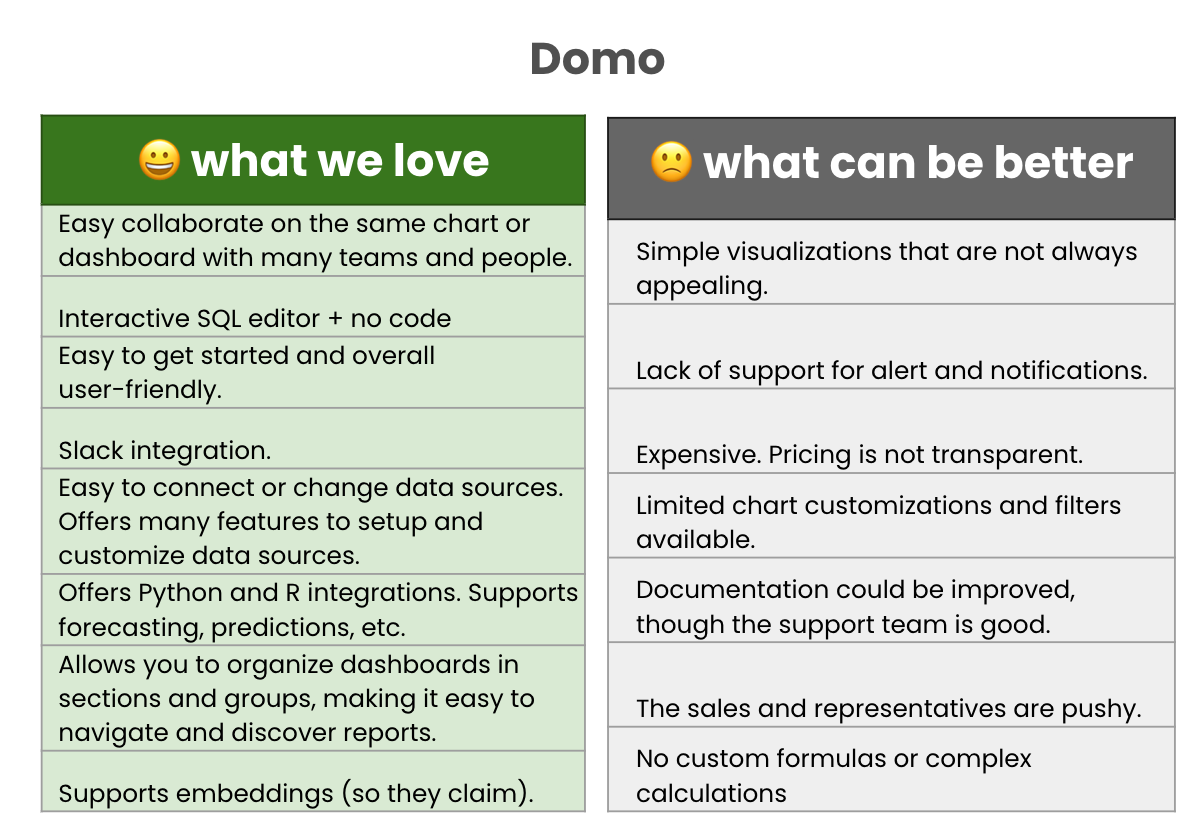
Domo
Domo has been around for quite some time now. I have been using it occasionally and appreciate its cloud-based nature and flexible features. However, I am not convinced that the expensive price tag justifies features that are not substantially different from those offered by open-source applications or their competitors.
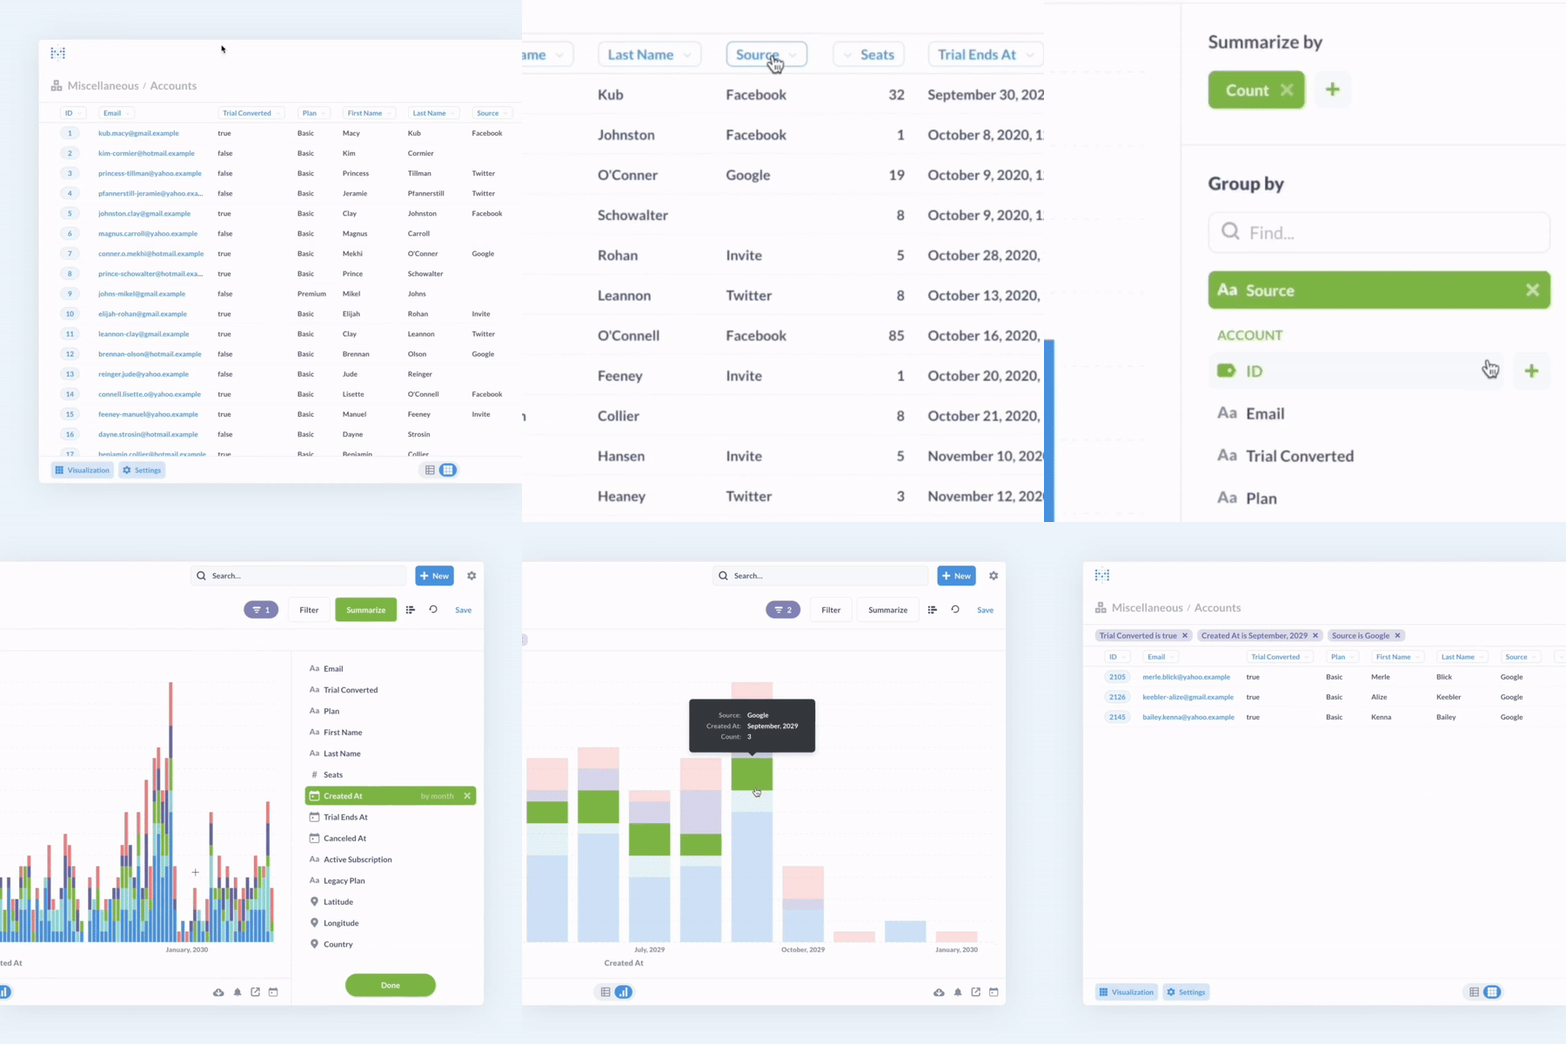
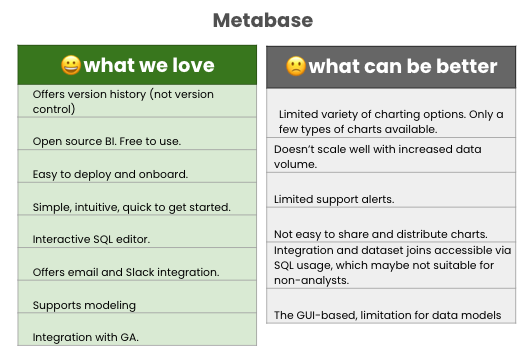
Metabase
Metabase is an open-source BI tool. I briefly used it a few years ago and am getting started again now. It’s perfect for smaller companies that focus on quick dashboards with a good view, and it also supports modeling. However, once the team grows, managing dashboards in Metabase becomes overwhelming, and as an open-sourced tool, it has quite a few limitations.
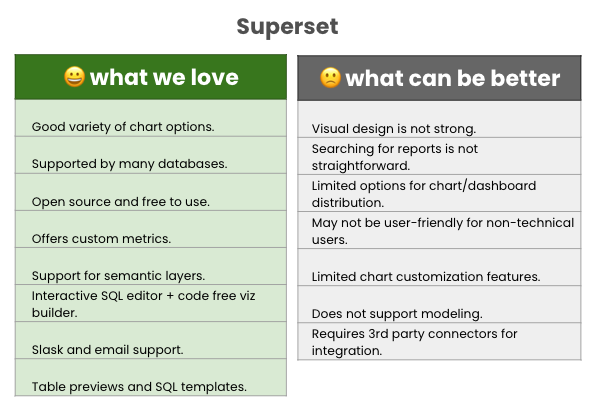
Superset
Very similar to Metabase, Apache Superset is an open-source BI tool developed by an Airbnb employee during a hackathon. I have never used Superset, so I will share feedback from other analysts:
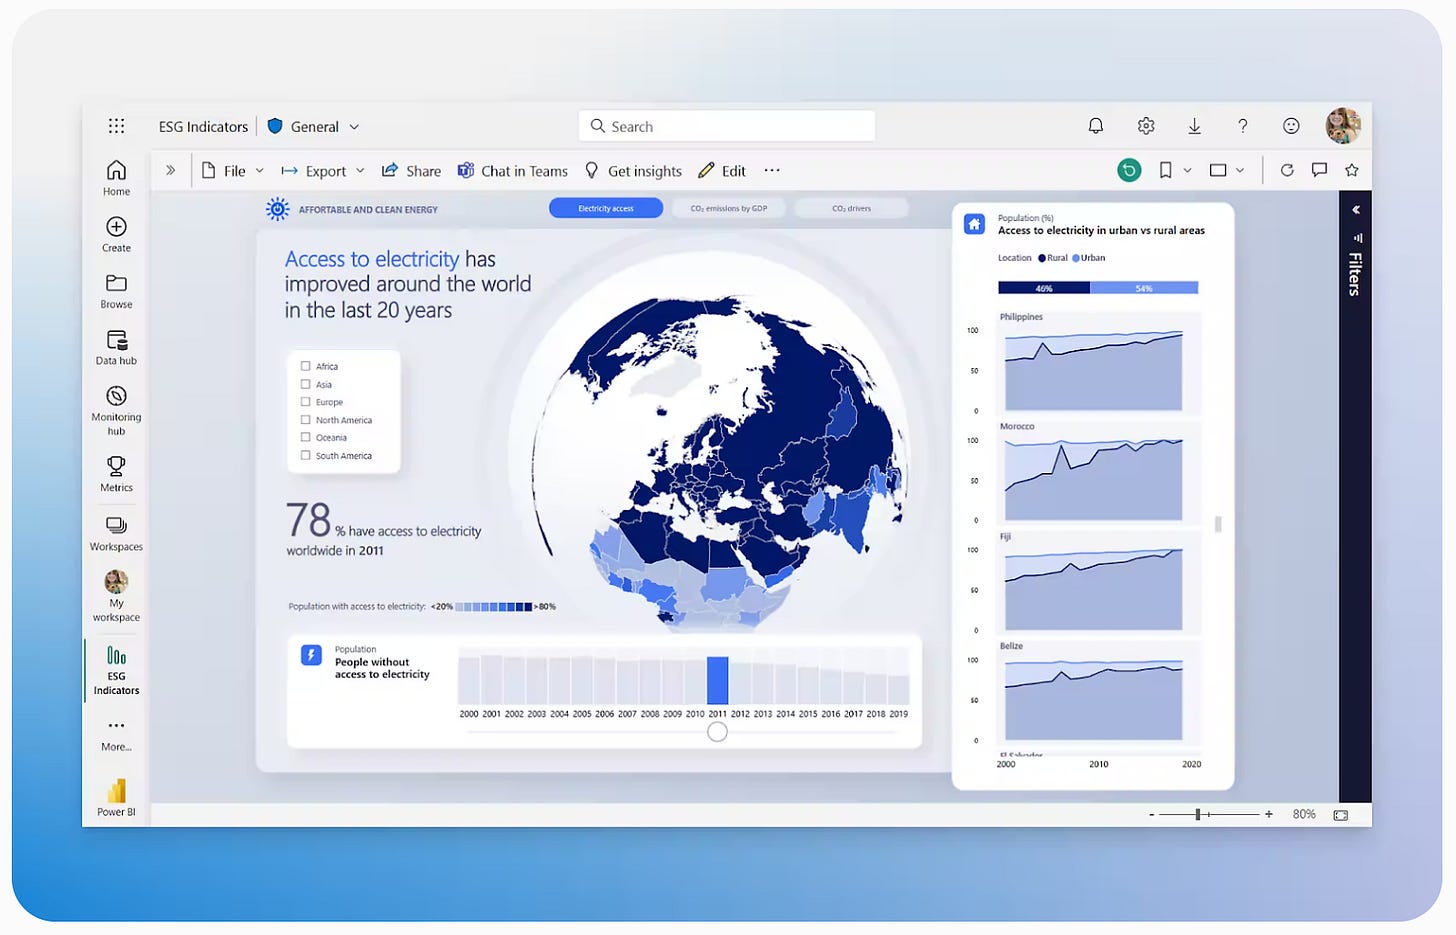
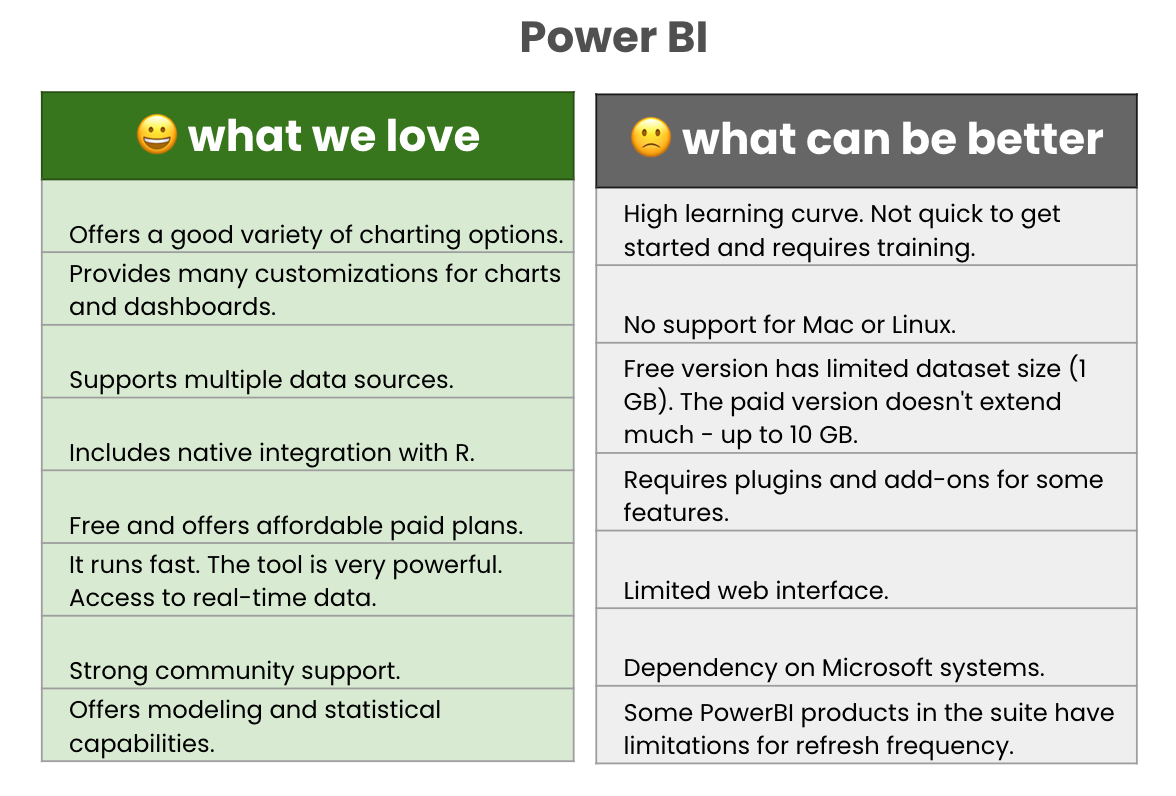
Power BI
The Power BI suite is extensive, including Desktop, Mobile, Embedded, Server, and Pro versions, available both on-premises and in the cloud. In my experience, the learning curve for Power BI is slightly steeper than for Tableau, but it operates faster and offers better visuals and customizations. Overall, Power BI is similar to Tableau.
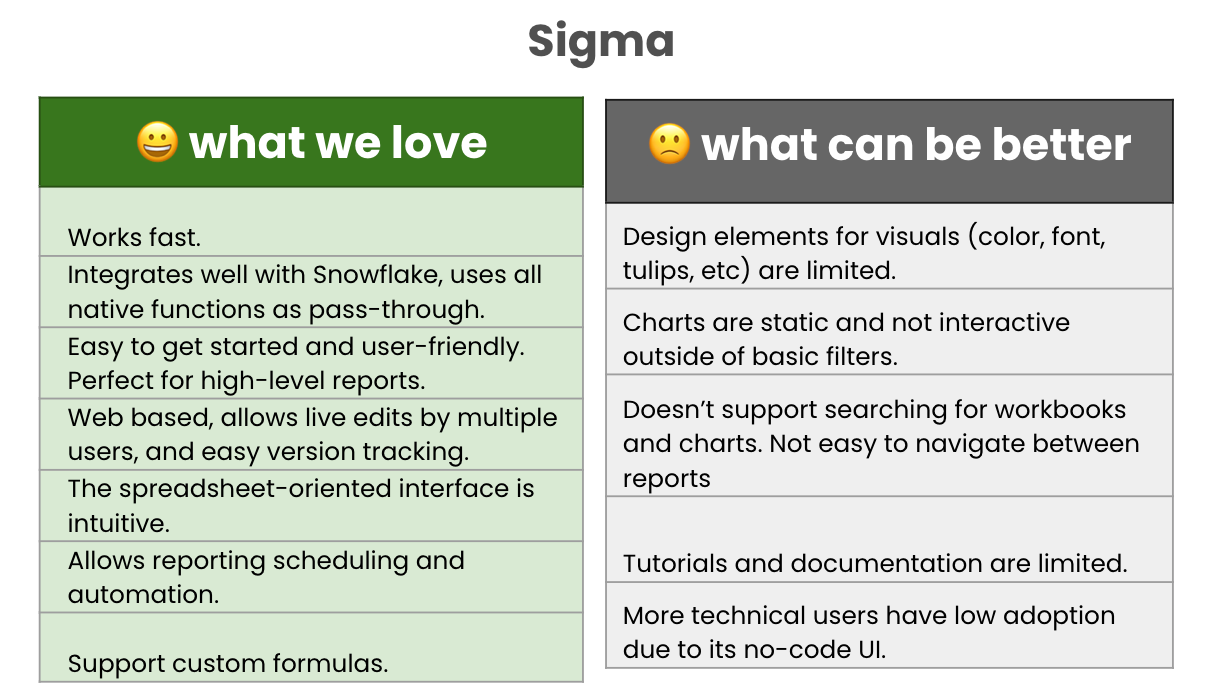
Sigma
After checking it out, I am not sure whether Sigma is a dashboarding tool or a new-generation spreadsheet, given the close overlap between them today. It's on my list to try. From the initial look, it appears to be positioned as a dashboarding tool with embedded analytics. Here is what we have so far:
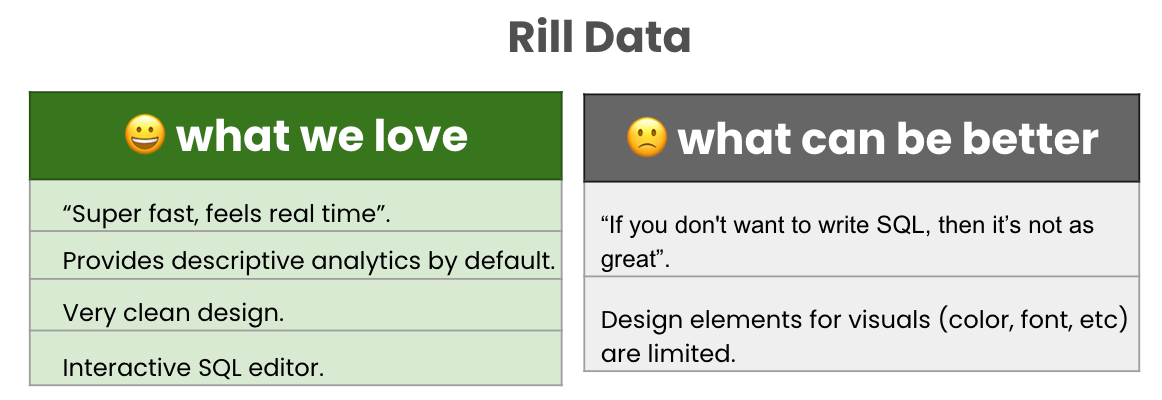
Rill Data
Rill Data, a new BI tool that was founded a few years ago in San Francisco, was described as “a faster and better BI dashboarding tool” that “could process database data much faster than simply taking it raw from the data source, whether that was Snowflake, Databricks, BigQuery or something else.” - from TechCrunch.
I haven’t had the opportunity to test it, but it looks intriguing. Here is some early feedback from the community:
Let’s explore it more, and I maybe will do a deep dive into it at some point. BI-as-code, product analytics + semantic layers, and embeddings look promising.
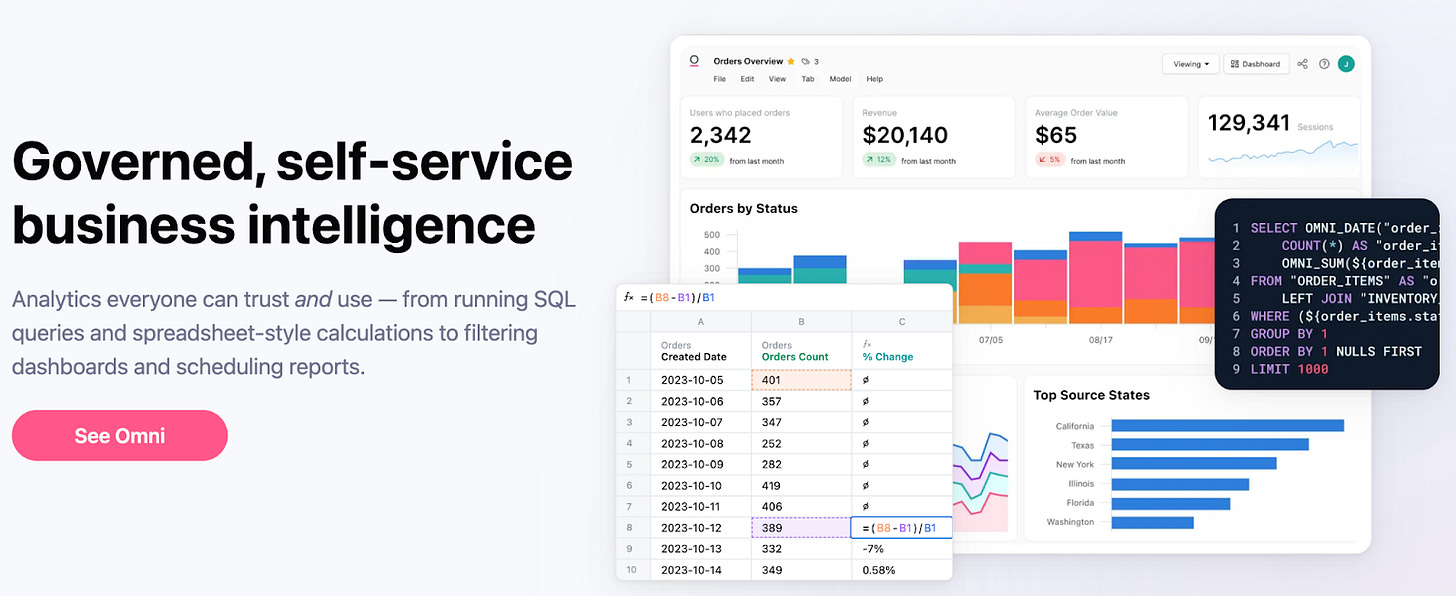
Omni
Omni is definitely a company to watch closely. With a total funding of $46.9 million, Omni is aggressively competing with Looker and Tableau, having served its customers for about two years. As expected, it’s now showing at every conference, cold-emailing everyone (including myself), and sponsoring customer reviews to establish itself as a prominent leader in BI dashboarding.
That being said, I don’t know anyone who is using Omni. They also don’t offer any freemium, demo, or trial options for us to explore their features. The only way to get more information on Omni is to set up a 1-on-1 demo with them, which requires providing your phone number, family history, blood type, and more. The cost of using Omni is also shrouded in secrecy - I couldn’t find any pricing or billing details, but I assume it's on the higher end.
After reviewing their documentation, case studies, and product offerings, I appreciate how they combine flexibility (with a focus on time-to-value) with governance (through curated metrics). I haven’t seen anyone else successfully implement this approach. I think Omni might become my favorite BI dashboarding tool once I test it, and potentially the strongest alternative to Tableau and Looker. We shall see.
I have to stop here for now, but there are so many other tools on my list to cover: ThoughtSpot, Holistics, Zing Data, Redash, Zenlytic, SeekAI, and LightDash, which I read is open-sourced and offers version control - I’d love to try it out. If you are using these platforms and have favorite features or areas that you think fall short, let me know!
Let's make analytics better 🚀📈.
Thanks for reading. Until Wednesday!






Hi! Thanks for the article! I’ve read it twice, but I still can’t figure out what your favorite BI tool is. Could you clarify what I might be missing? Thanks!
Omni pricing is 15K for 10 users to start off and discounts are pretty decent as you scale