
Spring Recap: 100 Winning Tests, No Growth
Reflections from data summits, industry shifts, and what we’re still getting wrong in analytics.

Welcome to the Data Analysis Journal, a weekly newsletter about data science and analytics.
I waited to send out the May recap so I could include highlights from the Snowflake and Databricks summits, which just wrapped up last week. Today, I’m sharing the latest news from the data world - what’s changing, what it means for us, and what we can do to adapt and grow, even when things in the industry feel upside down.
Apologies for the long and somewhat heavy newsletter.
Below, I’ll share updates on the key tools we use every day, new benchmark reports we measure against, new good tutorials, interesting publications and research papers that caught my eye, and other important developments impacting our work in data analytics.
But first, 2 quick personal updates:
I am heading to Europe this summer - Barcelona in June, Paris in July, and London in early August. I’ll be meeting with a few founders, analysts, and friends along the way. If you’re nearby, I’d love to connect and chat all things analytics.
I am currently looking for a full-time, on-site Product Analyst in San Francisco (40 hours/week). If you are interested in working with me or know someone great, please get in touch!

🔊 Advocating for analytics
Last month, I attended MAU in Vegas, the largest mobile app AdTech and MarTech conference, with over 2,000 apps. It was awesome to reconnect with colleagues, friends, and discover so many new apps. But I walked away with some mixed feelings about the speakers, talks, and content.
At an AdTech or MarTech event, of course you'd expect a focus on marketing, advertising, and store optimization. But what’s becoming concerning is how deeply marketing is starting to shape product—specifically how activation, retention, and product growth are being treated as extensions of marketing, rather than the other way around. Here’s what stood out:
1. Marketers still miss the point on Activation.
Many see activation as just the final step in onboarding, or “a high-value action,” without digging deeper. The few sessions that touched on user activation missed the mark. Activation is not measured against Trials or TTPs. It’s measured against long-term retention. And most importantly, it has to be predictive of retention. That means modeling behavior across time windows and activity patterns. Learn more - Why Your Activation Analysis Is Wrong - And How to Fix It.
2. Measurement is often overcomplicated or misused.
Another thing that frustrated me was that in every other talk, I saw a slide where an A/B test was measured against ARPU. Why? Are there no other (proper) measurements available?
I understand when founders or engineers run quick tests and check ARPU in RevenueCat or A/B Tasty to make a fast decision. But when someone with a “Growth Consultant” title uses ARPU as the main metric, it’s worrying.
Here’s the thing: unless you’re changing the price, a higher ARPU might mean fewer customers. ARPU = Revenue / Customers, right? So, if your customer count goes down, ARPU can go up. So, if your A/B test shows Variant with +25% increase in ARPU, very likely, that’s not a win:
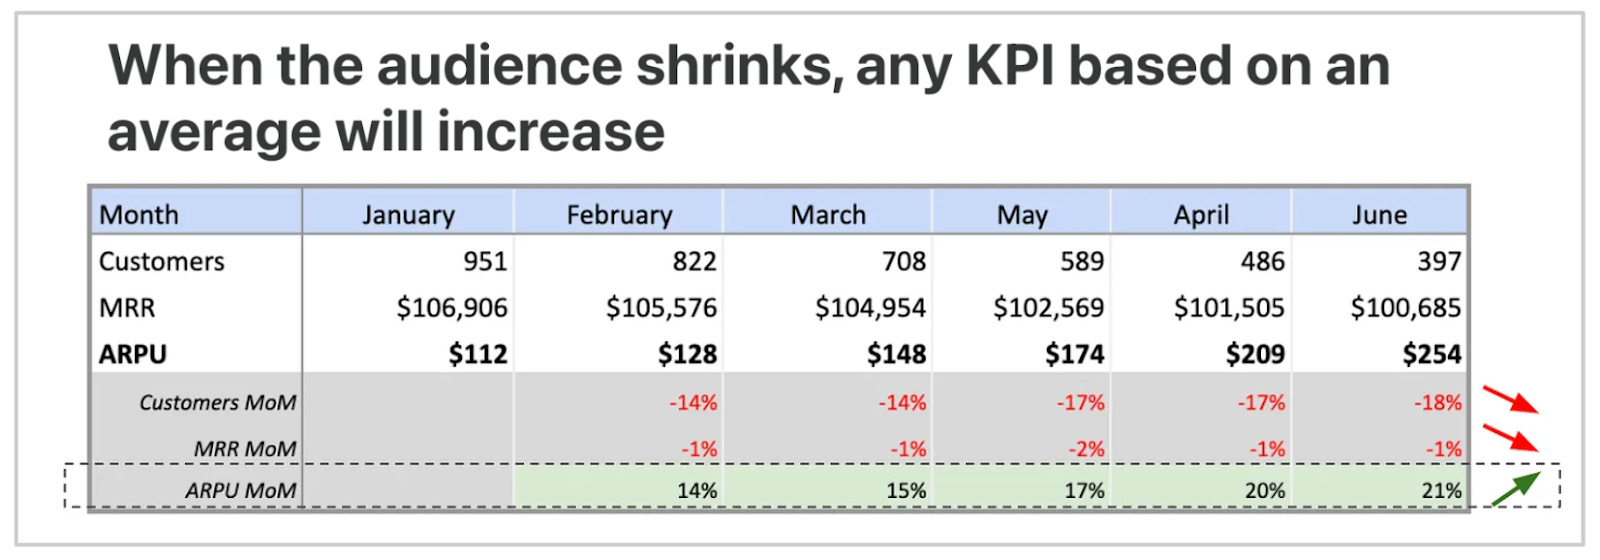
ARPU is a highly misleading measurement for paywall tests (again, unless you change subscription price, which is a different story).
If you are using LTV, it’s even more riskier. ARPU has 2 variables (revenue and customers), but LTV includes more (let’s break it down: (1) revenue, user lifetime, which is (2) recent renewal minus (3) signup, and minus (4) CAC in some cases), making it very hard to know what’s really changed. Without clear variable breakdowns, the results likely to lead you in the wrong direction. Please, don’t use LTV or ARPU to measure an A/B test:

My MAU frustration didn’t stop there. Sessions on retention, pricing, and monetization had often relied on flawed math or shaky logic. And then we wonder - why after 100 “winning” tests, the MRR growth rate doesn’t improve M/M? Please, invest in analytics and due diligence. It really does matter.
🔥 Last month’s highlights
Snowflake Summit
Snowflake Summit was fun. Who isn’t excited about 200 vendors offering slightly different versions of the same ETL tool?
This year, Snowflake focused heavily on data ingestion, catalogs, and agents. They also announced support for Postgres. But the highlight for me was Snowflake Intelligence - a new platform that lets you query any of your data using natural language and receive human-like responses and charts without writing SQL. I don’t see how this is different from Databricks’ Genie, announced a year ago... In any case, it requires (a) all data to be available in the data warehouse, (b) a very solid metadata layer to be built, and (c ) the right questions to be asked, which brings us right back to where we started.
Databricks Summit
Databricks Summit felt pretty similar - same crowd, same vendors with more Spark references. They announced full support for Apache Iceberg and Delta Lake, MLflow 3.0 for end-to-end GenAI pipelines, direct integration with SAP systems, a partnership with Informatica, and more. For me, the most surprising update was that Sigma, a tool built to support BI for Snowflake, is now partnering with Databricks.
Personally, I find Sigma to be a questionable choice for BI.
I’m currently working on a deeper dive into Sigma - talking to its customers and reviewing use cases, and so far, I don’t understand why teams would use it. So, the Databricks + Sigma partnership was unexpeated and raises more questions.
Amplitude AI Agent Launch
Last week, I had the pleasure of joiningt the Amplitude AI Agent Launch:
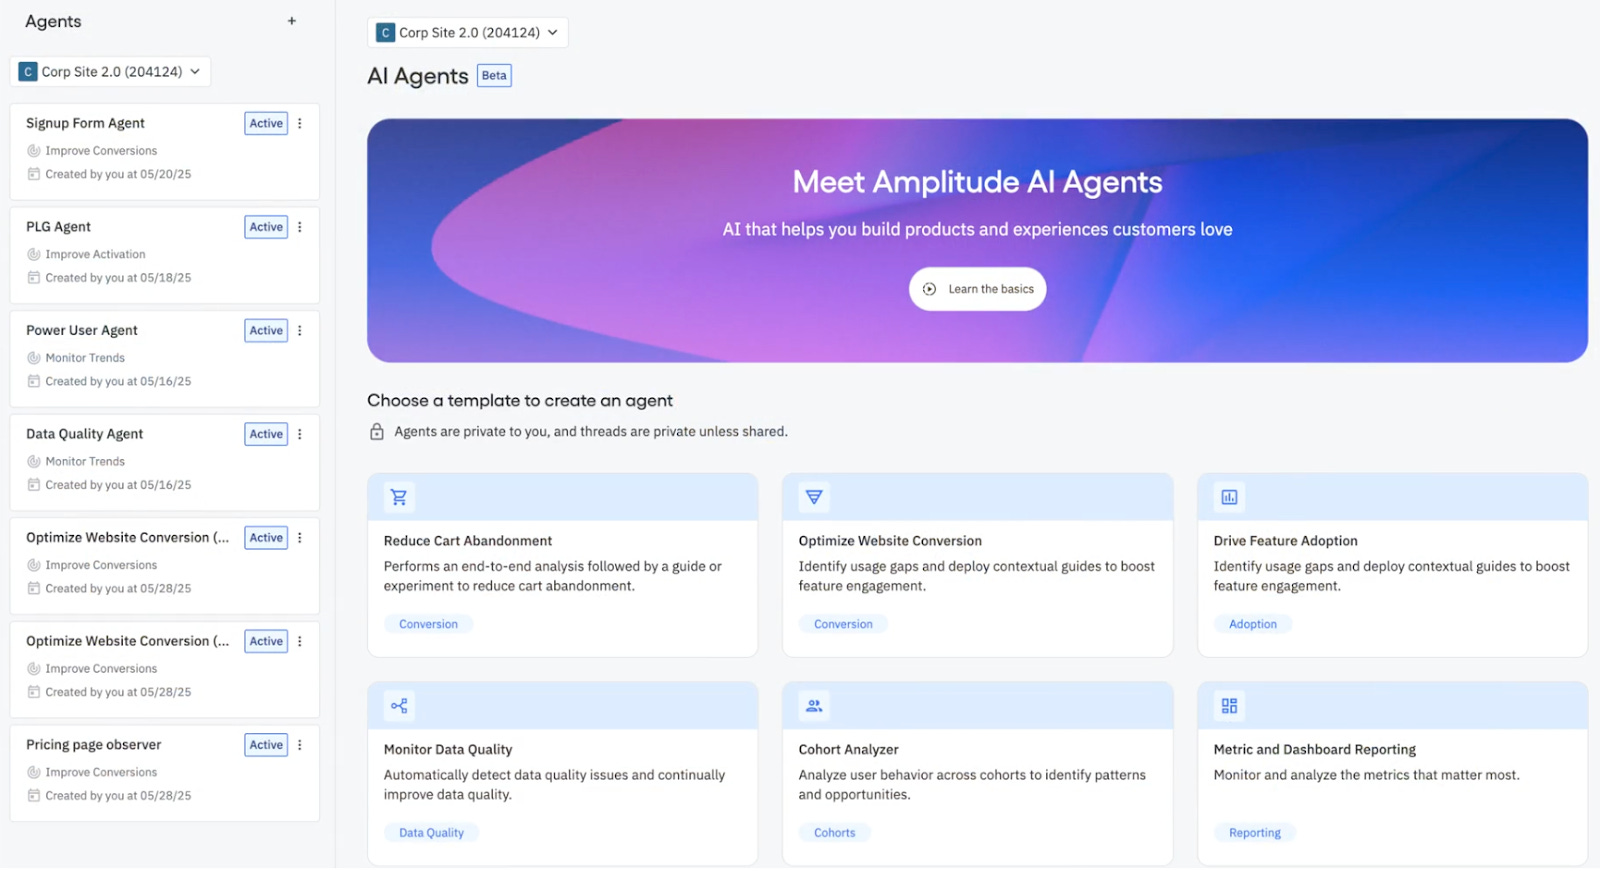
“Instead of acting on a vague alert like “conversion is down,” you now have a system that thinks like a proactive teammate—one that not only spots issues but digs into the why, proposes next steps, and runs experiments. While you focus on strategic priorities, your Agents are working in the background, testing multiple hypotheses, analyzing impact, and surfacing the highest-leverage insights.”
I haven’t had a chance to test the agent myself yet, so I can’t comment on how much value it delivers to teams. I’d say, though, that you can’t fix what you can’t see, so the success of any AI agent will depend heavily on how well your tracking and analytics are set up.
Also, the demo focused on a fairly simple use case: identifying web dead clicks. Is this really a thing? Real-life use cases for hypothesis testing and analysis are way more complicated, but the overall promise and product direction looked impressive.
If you’re using Amplitude, you can sign up for the beta and try it out (and I’d love to hear your thoughts if you do!)
dbt is upgrading. Meet the dbt Fusion engine.
“It’s the same dbt you know and love, but better and faster”.
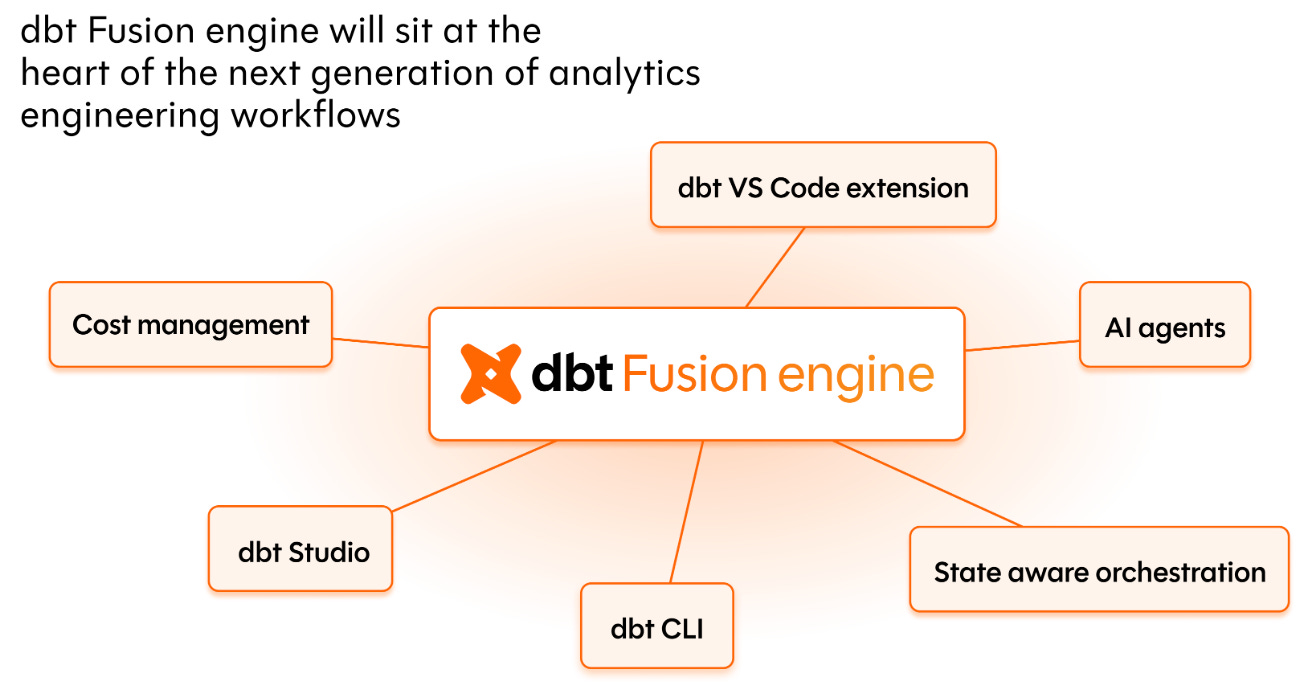
dbt recently announced the Fusion Engine, which is currently in beta. It promises a lot of new features for teams, including a VS Code extension, real-time error detection, faster parsing, and improved project execution.
I haven’t figured out yet whether Fusion needs to be installed alongside Core or if it fully replaces it. From what I can tell, you’ll likely have to make a choice: stick with dbt Core, or get your team ready to “invest” and upgrade to Fusion.
📈 New industry reports and benchmarks
The SaaS Go-To-Market Report from ChartMogul
Mary Meeker's 2025 AI Trends Report: An In-Depth Product Analysis
⚙️ Know your craft
Not sure which chart to use? This cheat sheet from Metabase will help you choose the right chart for your data.
Five simple things that will immediately improve your diagrams from Vexlio
What is embedded analytics? from Metabase.
The essential guide to user journeys for product teams - a must-read guide for product analysts from Mixpanel.
Visualizing the World of Causal Inference from Vasco Yasenov, a Staff Data Scientist at Adobe.
99-ML-Learning-Projects - A list of 99 ML projects for anyone interested to learn ML from coding and building projects.
The 80/20 Guide to R You Wish You Read Years Ago from Amol Borkar
🤓 Analysis and case studies
Last month, I published Introduction to Forecasting, followed by Part 2 - Forecasting in Analytics: Choosing the Right Approach, followed by an interesting discussion on LinkedIn where people asked me to break down my manual projection approach. So, now I’m working on Forecasting Part 3, coming (hopefully) soon. It’s not easy to consolidate, because forecasting revenue is very different from forecasting subscriptions or MAU. And completely different from projecting churn or growth rates. I’ll likely need to break it down by use case and product type to make it usable.
Faster, Smarter, Cheaper: AI Is Reinventing Market Research - from a16z
🎓 Tutorials
Not a tutorial, but I wanted to share that RowZero, a fast-growing spreadsheet for big data, has launched a free plan for students and recent graduates who want to learn analytics and get comfortable with big spreadsheets, functions, pivot tables, charts, etc. The platform lets you explore large public datasets, collaborate with others, and publish your research.
Thanks for reading, everyone!
not to be picky but when you saying ARPU you're saying essentially ARPPU right (per paying?)
went back and forth calling a d30LTV vs d30ARPU ha (since they in theory are the same)
also, love your callout of what happens if you have less paying users but more per paying sub
but somehow still struggle to think of a better way to measure say for example monetization mix offering (paywall) than timebound rev/user
(of course you have to look at every input to these conv rate, refund rate, etc) but what would you recommend when it come to yeah say testing $29.99/year vs $49.99/year as example
Thanks, Olga for mentioning an entry from my newsletter.