
April Recap: Stop Buying Users You Already Paid For - Issue 314
Your monthly recap of the latest trends, market shifts, and updates in data science and analytics.

Welcome to the Data Analysis Journal - a weekly newsletter on data science and analytics.
If you missed the April posts, here’s the roundup:
Amplitude Agents 101: How They Work + 20 Prompts to Try - An introduction to using AI in Amplitude, including a guide to Amplitude MCP, Global Agent, specialized agents, and the prompts that make them more useful.
Claude for Excel: What It Does Well - and Where It Still Falls Short - How to get started with AI in Excel, what Claude for Excel does well, where it still fails, and how to use it safely for analytics and finance.
How to Choose the Right Proxy Metric for an A/B Test - There is no single best proxy metric that works forever. The right proxy depends on the size of your experiment, and the best way to choose it is to learn from your past tests instead of reusing the same metric again and again.
May is already shaping up to be a very busy month for data scientists.
This week starts with the Data Governance Summit and Tableau Annual Conference in San Diego. Next week, I’ll be in San Francisco for Data Council, Mixpanel, and SaaStr - all happening on the same days, (purposely?), I assume to test our scheduling models. I’ll clone myself.
After that, I’m heading to Las Vegas for MDM + Informatica and MAU, which, of course, also happen at the same time. Hope to see some of you there. Somewhere.
Today, I have the key April updates for you across data science and analytics, including new case studies, analyses, and developments shaping the field - so you can stay informed, relevant, and maybe explain the news to your coworkers before they forward it to you.
🔊 Advocating for analytics: The ROI case for investing in existing users
As someone who was “raised” by high-retention products and apps that build long-standing, frequent relationships with users (think Strava, Calm, MyFitnessPal, Glow, Coinbase, and others), I really struggle to understand the newer batch of apps (AI or not) that mostly monetize through high-volume user acquisition without any real intention of building stickiness or retention.
I don’t want to recycle the same old point made by literally every analyst: durable, sustainable growth comes from retention, not acquisition. But what do you do when many apps don’t expect, and don’t even aim for, long-term usage?
Some apps seem to exist almost entirely to monetize the Day 0 user interaction. They invest heavily in optimizing the first 24 hours of the user experience, and then barely care what happens after that.
My problem with that is that many of these apps are sitting on a massive pool of lapsed users. These are users who signed up, finished onboarding, but failed to activate and never converted. Most never returned after Day 1. Some uninstalled the app, but many others did not. They are simply asleep. They sit in your database, quietly adding storage and processing costs, while the team does nothing to wake them up.
Instead, all the budget and attention go to the next batch of new installs - only a tiny share of whom, maybe 0.24% if you’re lucky, will contribute to whatever monetization model the app has.
For one app I know, the pool of sleeping users is over 350 million!
Think about this: a simple push notification CTR benchmark is around 4%. Even if you get only half of that, you are still reaching a meaningful share of users who already know your product, already installed your app, and already exist in your system. This is not ROI yet, though, a click is not a purchase (but what if you’re running ads?).
Once users come back from a push notification, then you can use in-app messaging, paywall tests, lifecycle offers, and product nudges to move them toward conversion. So add to this the 12% in-app message CTR benchmark to estimate the resurrected MAU opportunity.
I used to operate with a 5% in-app message-to-purchase rate, which is high, as these are woken-up, engaged users. But every app is different - let’s assume a modest-to-conservative funnel:
3% push CTR
10% in-app message CTR
1% purchase conversion after the message click
Such a sleeping-user pool could still generate around 10.5K purchases with zero additional spend. Imagine all that free money just sitting there.
Well, depending on how much Braze costs today… Maybe not exactly free money. But still, way cheaper than buying the same user twice. You already paid to acquire these users. You already store their data. You already have the audience.
It doesn’t matter whether you expect users to leave after signup, or this is a utility, wallet, e-commerce, traveling, or the app designed for occasional, seasonal, or rare usage - the math still works. And yet, instead of trying to reactivate even a small fraction of them, many teams keep pouring money into acquiring more users, 80% at least of which will likely follow the same Day 0 → Day 1 → gone path.
I’m being Captain Obvious here, and most teams understand the math well before I come in to break it down for them with an attitude. The main reason things stay this way is usually not the math. It is (1) a lack of ownership and (2) a lack of developed processes and workflow for re-engagement, which mainly means… a lack of ownership.
Who owns re-engagement? Who owns paid retargeting? Is it monetization, product, or lifecycle? Who is responsible for waking these users up?
Which brings me back to my earlier question: Who Owns Growth? (And Why Analytics Pays the Price). In this case, though, it is not only analytics paying the price. It is the entire company.
Back to new user vs existing user value, if you still need convincing, here are recent predictions from AppsFlyer:
“2026 outlook: As the mobile market matures and UA costs rise…, 2026 is expected to accelerate the shift toward a “Retention First” economy. With Gartner (2025) reporting that 80% of future revenue for mobile businesses will come from just 20% of existing customers, the strategic imperative will lead to greater focus on maximizing LTV of existing users.
As a result, remarketing investment is also expected to increase in 2026. In a stabilizing economic environment where “growth at all costs” is replaced by profitability, reactivating a dormant user will be viewed as more capital-efficient than battling for a new one in a crowded space.”
🔥 April highlights
Google Cloud Next 2026 - what we need to know
Google is trying to turn BI + data platforms into an “agentic analytics” stack, with BigQuery, Looker, Data Studio, and Knowledge Catalog all moving toward governed AI agents:
Google released a new “context layer” for AI agents called the knowledge catalog. The goal is to give AI agents trusted metadata, business definitions, semantic context, verified queries, and governed search. It aggregates metadata across BigQuery, Firestore, Looker, Atlan, DataHub, and enterprise systems (e.g., Salesforce, SAP, ServiceNow, and Workday).
BigQuery got Graph + AI features: semantic logic moves into the warehouse, new anomaly detection features, and more ways of working with unstructured data.
Looker becomes “agentic” with BI agents, dashboard agents, and assistants. They also re-branded Looker Studio back into Data Studio with a new mission: “BigQuery conversational agents and Colab-built data apps”.
Omni has raised a $120M Series C, bringing the company to a $1.5B valuation.
People claiming that AI killed BI are clearly wrong. Omni is showing the opposite, with reported 4x year-over-year revenue growth.
I’ve been working on a separate deep dive on Omni, similar to the ones I did on Superset, Power BI, and other BI. I’m looking to speak with analysts who are currently using Omni and are open to sharing their experience. Please reach out if you’re open to sharing your feedback.
Hex continues to invest in AI, and this time, in visualizations.
As a Hex power user, one thing that bothers me a lot with Hex is visualizations. Their features are great - I love the context studio, the app, threads, I trust their agent, and despite what some people say, I also appreciate that you have to approve and confirm agent changes to unblock it. But one thing keeps bothering me: the quality of AI-generated charts.
Not once have I been able to simply show a chart created by AI to anyone. It’s either painfully simple or wrong: incorrect chart type, wrong axis labels, not visually appealing including very questionable color choice), missing details, or else. I got used to finishing the charts myself with plots directly there in the notebook, but there had to be a better way.
Last week, the team announced improvements to visualizations: “The Hex agent can now build more beautiful charts, including dual axis and charts with reference lines”. I’ll be testing it more, truly excited about this.
Women in Data Science study - participants needed!
McGill University is running a study on gender in data science. If you’re a woman working in data science, please consider participating in this interview-based study. Participants will share their experiences, both good and bad, discuss some of their projects, and reflect on what they’ve learned.
If you’re interested, please email Emmanuelle Vaast at emmanuelle.vaast@mcgill.ca or reach out to her on LinkedIn. Your participation would be greatly appreciated.
In other news:
If you missed Metabase JOIN, session recordings are here.
RillData introduced Metrics SQL: A SQL-based semantic layer for humans and agents.
CEO cancels BI tooling, replaces it with AI, breaks everything.
📈 New industry reports and benchmarks
Customer messaging in 2026: Email, SMS, push, in-app from Customer.io
State of Digital Analytics 2026 from Mixpanel.
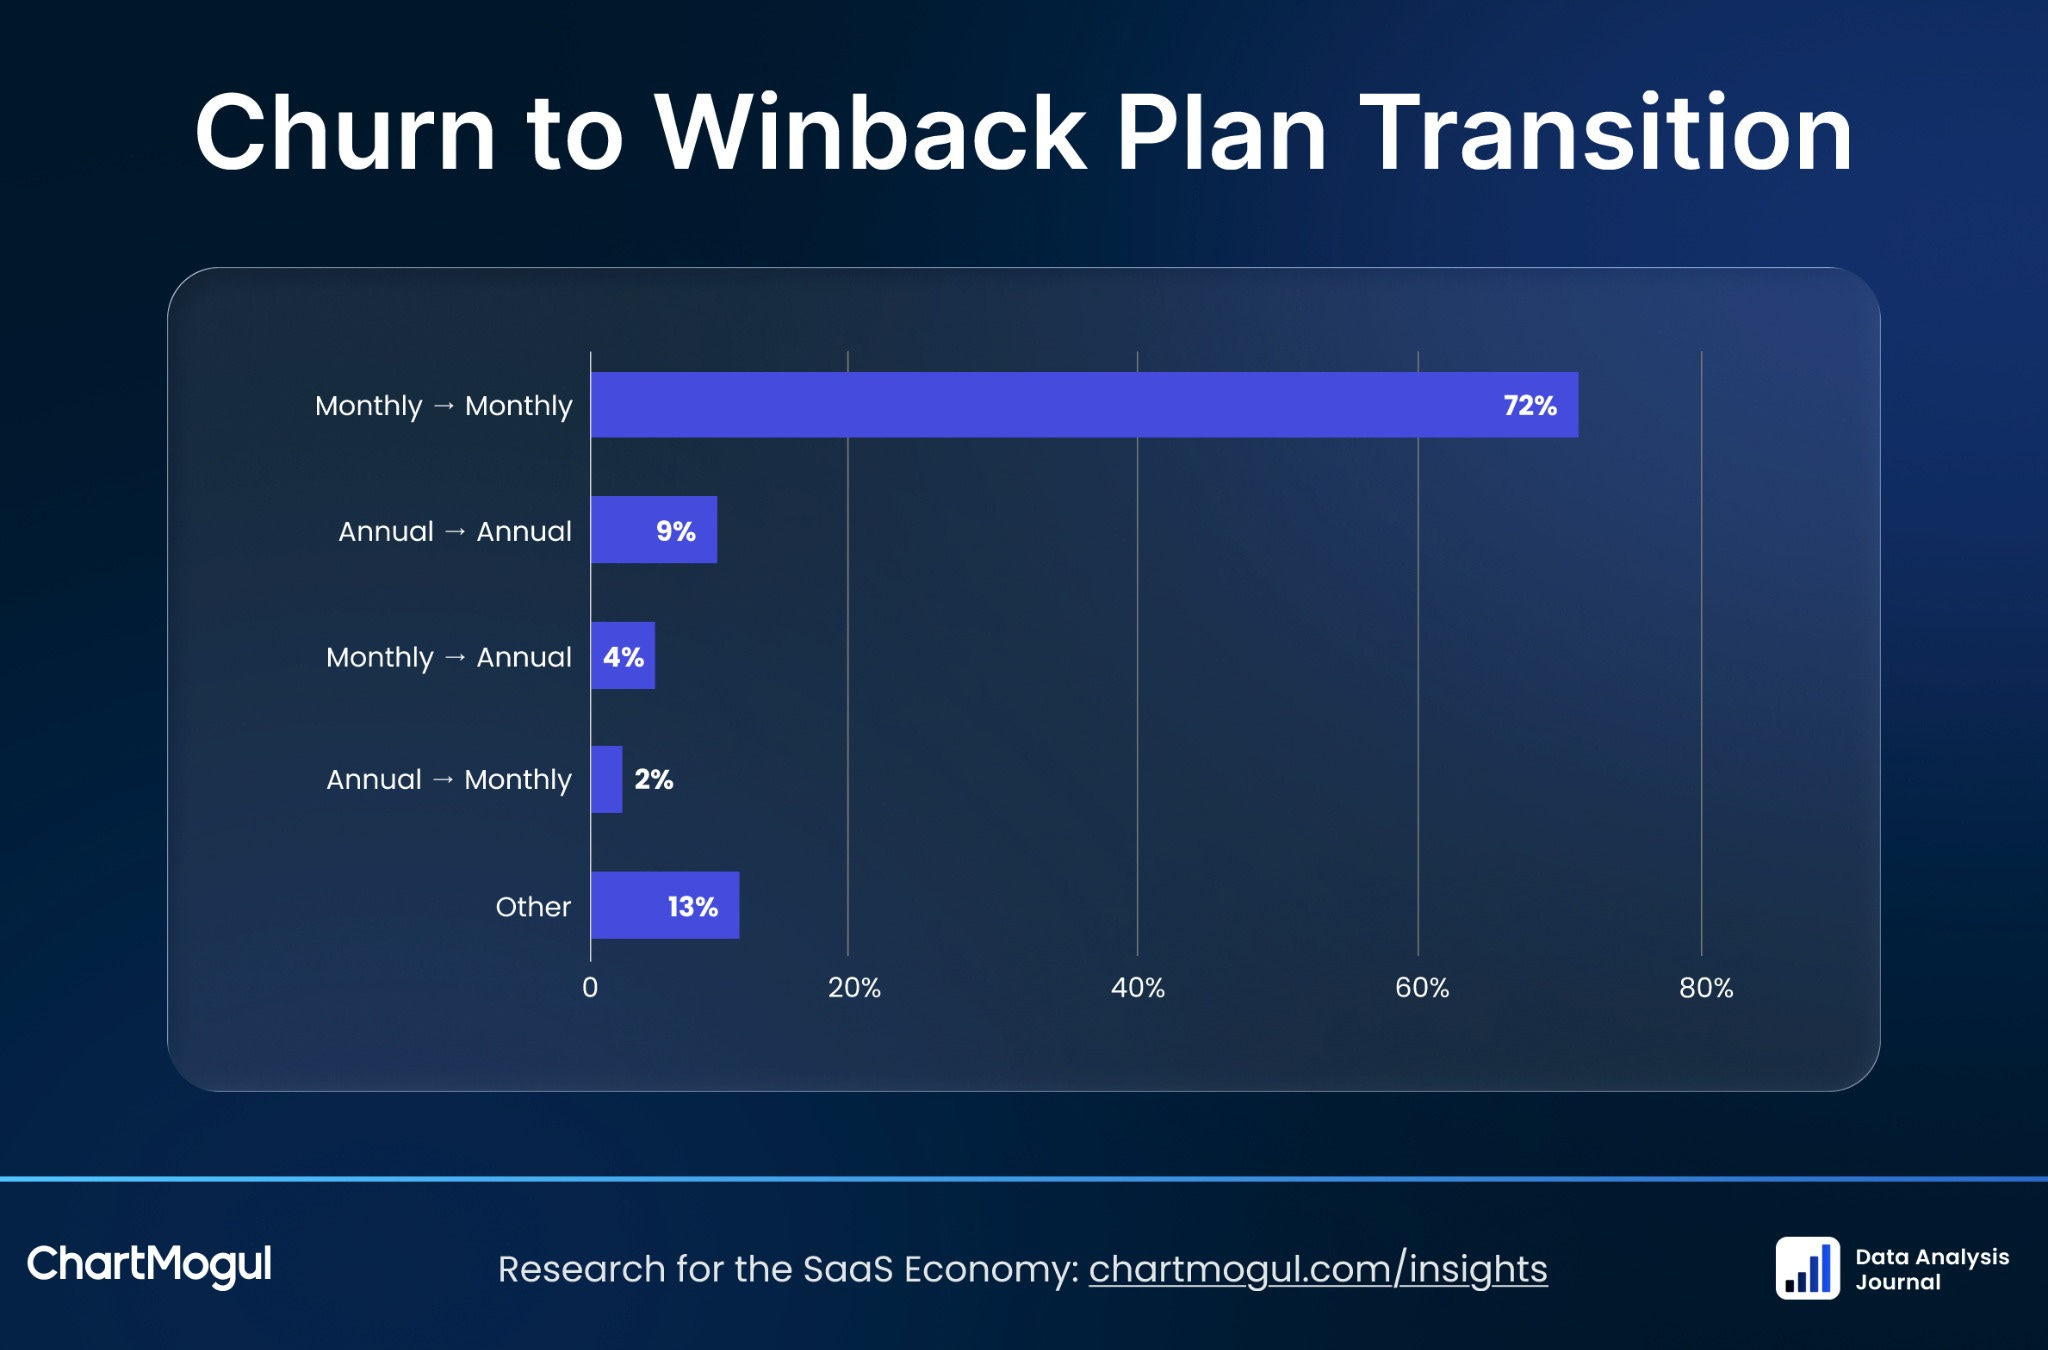
I’m very excited to publish my own benchmark report this month!
With the help of the ChartMogul team, I analyzed data from 3,974 companies and 4.78 million returned customers to better understand winbacks.
Winbacks are both underrated and extremely important. One of the biggest findings is that they are heavily front-loaded. About 45% happen within 30 days, and 66% happen within 90 days.
The data also shows that the longer customers stay churned, the less likely they are to return - and if they do return, they are more likely to come back at a lower value. So timing matters. With winback, every day counts.
You can see the winback benchmarks, understand where you stand, and learn how to approach winback strategy here: Why Winbacks Are One of the Most Important Growth Signals.
📚 Weekend Longread
Not a read, but a listen this time - Why Traditional Statistics Still Matters in the Age of AI. Prof. Rob Hyndman is one of the world’s most influential applied statisticians. He published over 200 research papers, co-authored more than 65 R packages, and wrote 5 books on time series forecasting. He is also a Fellow of both the Australian Academy of Science and the Academy of Social Sciences in Australia. I loved his interview on why rigorous statistical thinking remains important in the age of AI, and what data scientists are giving up when they abandon it.
⚙️Know your craft
7 analysis skills to teach your AI client (and the prompts behind them).
I Let Claude Code Build ELT Connectors. Here’s What Happened
❤️ 10 favorite publications last month
When data experts become data philosophers
Measurement Engineering: The Part of Data Science That Will Thrive in AI from Eric Weber
So you’ve been asked to “take over” some old data pipeline… from Counting Stuff
Data agents: When enterprise analytics learns to reason from Pratish Yadava
📊 Monthly Chart Drop
✈️ Upcoming events in April
May 4-8, San Diego, CA: Enterprise Data World + Data Governance
May 5-7, San Diego, CA: Tableau Conference
May 6-7, Boston, MA: Data Summit 2026
May 6-8, Stockholm: 11th Data Innovation Summit 2026
May 11-13, London, UK: Gartner Data & Analytics Summit 2026
May 12, San Francisco, CA: Mixpanel | MXP 2026
May 12, Menlo Park, CA: Data Connect 2026
May 12-14, San Francisco, CA: AI Conference (aka Data Council) 2026
May 12-15, San Francisco Bay: SaaStr AI Annual 2026
May 13, NY: DSS: The Future of Applied AI in Finance and Banking
May 16, London, GB: Data Science Festival 2026
May 18-19, San Jose, CA: AI & Big Data Expo
May 19-21, Tokyo, Japan: Gartner Data & Analytics Summit 2026
May 19-21, Las Vegas, NV: MAU 2026
May 19-21, Las Vegas, NV: Informatica World 2026
May 20, virtual: Semantic Layer Summit
May 20-21, Dubai: 11th Data Innovation Summit MEA
May 20-22, Malta: World Data Summit
May 21, London, GB: Mixpanel | MXP 2026
May 20-29, Chicago: Data Science Conference
May 31-June 5, Bengaluru, India: SIGMOD/PODS Conference
Also, check this calendar for the full list of data and analytics events this year - The Biggest Data, Analytics, and AI Conferences of 2026.
Thanks for reading, everyone!