
Inside Product Analytics: Decoding User Behavior - Issue 173
Introduction to Product Analytics: required skills, common projects, and navigating challenges.

Welcome to the Data Analytics Journal, where I write about data science and analytics.
This month, paid subscribers learned about:
When To Use Client-Side Or Server-Side Data - The differences between types of data sources and how to figure out which data to use for analysis, modeling, or reporting.
When To Use Mean Or Median - The cases and examples when it’s acceptable to use Mean vs Median and when it’s okay to use both.
An Analysis Of Bias Or Why A/B Testing Fails - A recap of Stanford and Airbnb's collaborative paper on A/B test setup and analysis in two-sided platforms and marketplaces.
I can't believe it took me that many months to write an introduction to product analytics.
Last month, I went through a few online classes and tutorials on product analytics on Udemy and GoPractice and checked Reforge, The Product Folks, and Coursera to see what people teach today. I was disappointed that I couldn’t find one class that fits the skills, knowledge, and perspective needed to succeed in product analytics today.
Many classes I saw tend to minimize the entire product analytics domain to only SQL, data collection strategies, or A/B testing. Yes, it's absolutely an important part of it. But there is so much more to product analytics. Knowing SQL and having the ability to extract insight from data doesn’t make you an analyst. Similarly, proficiency in Python does not equate to being a data scientist.
So today, I want to focus exactly on this: What is product analytics? How does it differ from legacy BI, and what skills, qualifications, and experience are required to enter this field? And what does it take to navigate and grow within it?

Why has product analytics suddenly become so popular?
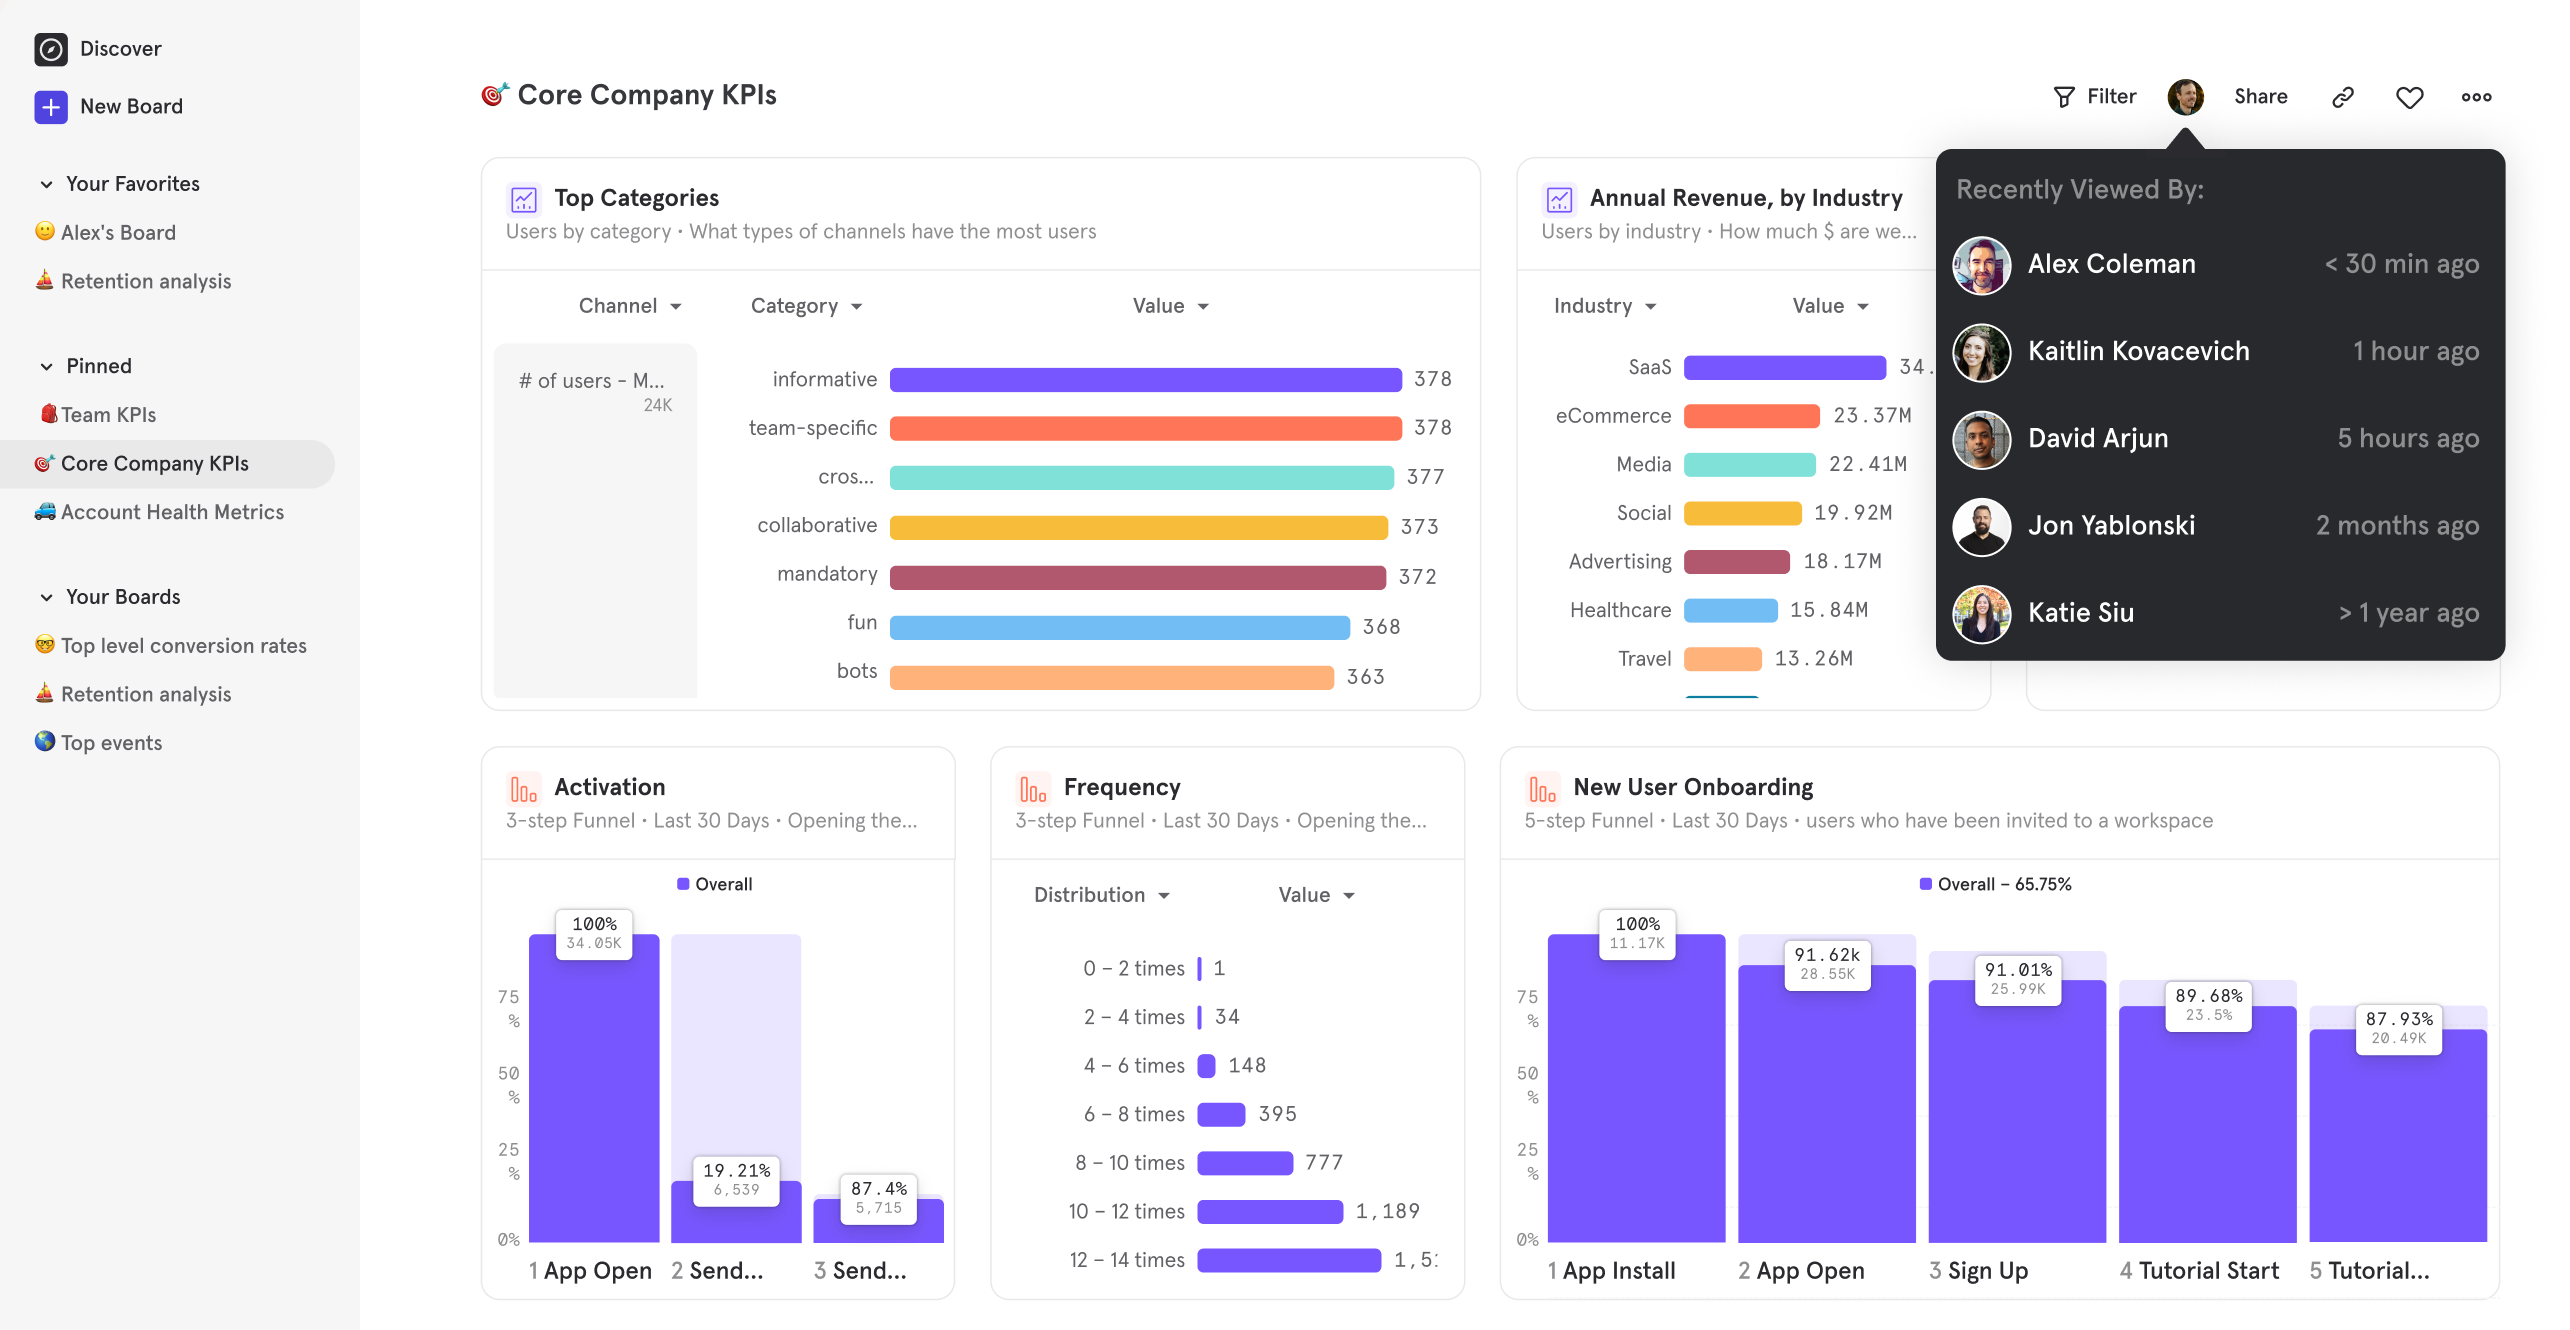
My take on it is that digital analytics tools like Mixpanel, Amplitude, or Heap have played a significant role in driving this trend. They position themselves with the aim to "understand customers’ end-to-end journeys, improve conversion and activation, increase retention, and deliver a great user experience." The trend gained rapid momentum as more mobile apps were released, and more teams began asking for better behavioral funnels, cohorts, and flow measurements:
The methodology for analyzing user behavior using event data has been around for a long time, but this new era of tools has contributed a lot to the formation of a unique domain and a new type of analyst.
I'd like to differentiate the domain from the tooling, though. Maintaining the event analytics alone does not make you a product analyst. Many data professionals don’t understand the distinction, often confusing the discipline with tools. Analytics engineering is another similar example.
Skills and requirements for product analysts
Product analytics, foremost, is analytics. Its core foundation remains the same despite better tooling, larger product teams, and a seat at the table to explain what DAU should be.
The essential requirements for product analysts stay the same as any other analyst:
Understanding business, strategy, and KPIs
Statistics
Modeling
Causal inference
Critical thinking
Data acquisition and collection
Reporting and dashboarding
Additionally to these qualifications, product analysts should understand how users interact with their products and how they navigate between the screens, web pages, funnels, and banners. What makes them come back, upgrade, share, post, etc.
🤔 This is an unpopular opinion, but I’m convinced the best product analysts are people transitioning into analytics from UX design. UX designers have a strong intuition of user psychology and perception and understand user journeys well. The better you understand how users interact with your product, the more successful you will be at estimating baselines and seeing the story behind the numbers.
One of the most common questions I receive is whether analysts should learn SQL and Python to support product analytics. Yes, regardless of the era of no-code tooling, you should be able to extract data, process it, analyze it, visualize it, and make inferences. Personally, I prefer notebooks for analysis over dashboards or Excel reports, so I expect my analysts to be proficient in SQL and Python. However, every company and team varies, and you might be asked to work mainly in PowerBI, Excel, or SPSS (if they are still in the 90s).
📊 Product analytics behind the scenes
Product is a subset of the business.
As a product analyst, your responsibility involves translating each business KPI into suitable product metrics and then using these metrics to measure product initiatives. For example:
Monthly retention → into MAU.
MRR/ARR → into successful transactions.
Churn → into net new cancellations.
Subscription renewals → into successful payments.
It may sound like these are the same things, but they are not. The nature of data is different, and its meaning, lift, and impact are also different.
Product analysts face the challenge of explaining why traditional business KPIs might not be suitable metrics for assessing the impact of product initiatives. These KPIs primarily serve as ecosystem health indicators meant to describe the state of business and safeguard it against various seasonal, external, and micro effects.
However, when conducting an A/B test, relying on metrics like retention might not accurately reflect the lift of an initiative. For example, Variant users might come back to your app 1% more than Control because 62% of them can also be part of other hidden effects you won’t be able to capture or measure, including phone settings, a new TikTok viral campaign, or unrelated factors like plum season or time change.
Retention is an ecosystem KPI. It is not sensitive to isolated fluctuation or noise. It isn’t designed to be sensitive because it’s an output metric (read Common Mistakes In Defining Metrics by Brian Balfour). However, clicks, page opens, and transactions are good for capturing immediate responses and variations, thus offering a more nuanced view of specific actions or behaviors.
Product analysts should:
Understand which metric is appropriate to measure product initiative.
Develop a system and calculations to translate changes in sensitive metrics into either a lift or decline in business KPIs.
There isn’t a universally applicable framework to adopt since every product is unique. My approach involves mapping each KPI to at least 5-7 product metrics and then linking each product metric to 10-15 user actions (depending on what you measure and the nature of your product). This mapping is essential to understand how a 45% increase in signup to paid funnel translates into a 0.002% lift in net new MRR or LTV.
Product analysts work with low-trust data.
We know data is never perfect, never clean, garbage-in-garbage-out, and all of that. But unlike BI and old-school data analytics tied to polished data marts and data lakes, product analysts are also expected to work with very different nature of data - events and their properties and attributes rather than users or transactions.
The difference is that users or transactions come through layers of definitions and processing and are ready to be consumed in a nicely structured format. Every user_id is properly assigned to a user; every translation has a record and ID, and a set of backend services behind responsible for ensuring its trust.
This is not the case at all for product data, which often is event-based (it also may not be). If it is event-based, it is likely to come to your report from the client directly before landing at any backend service or a database that could verify it or put some trust into it (Read more - When To Use Client-Side Or Server-Side Data).
As a product analyst, be prepared for the possibility that up to quite a few of your users could be bots, test profiles, system users, or duplicative users utilizing multiple devices and browsers. Often, confirming the exact number of such users is not easy. Product analysts need the skills to confidently navigate such an environment and develop creative strategies to ensure some degree of acceptable trust in this data. They have to learn to deliver results when numbers don’t add up. And this is where most of us fail.
Ironically, the main purpose of any data analytics team is to represent trust, correctness, and confidence in data reports.
Reporting revenue metrics or business KPIs demands accuracy. So, as expected, legacy BI approaches product data with an expectation of precision and correctness. However, the reality is that there is no precision or accuracy in client sessions, cookies, or events.
Therefore, as a product analyst, your work and routine revolve around establishing checks, validations, and baselines to ensure that your numbers “almost make sense“ or are at least directionally accurate.
Here are some examples of the data health checks I run when onboarding or starting to work with a new product/dataset:
Check DAU: Session start vs. Login vs. App open vs. Screen View should be similar and remain consistent across regions and platforms. However, they rarely are.
Check if new users are included in the DAU count. Most new apps include new users, but matured products will likely have a method to exclude them.
Examine DAU/MAU and WAU/MAU ratios: DAU/MAU is not expected to be over 50% unless “unless.” (It can be above 50%, but that story is different).
Check the frequency of usage: If ~30% of users use the app/product more than 2-3 days a week, the WAU/MAU ratio should be above 60%.
Verify if the current Retention reporting is based on the same activity metric as DAU. It's often not the case. It should be the same.
Check if running ML uses the same activity metric to model recommenders, predictions, and forecasts.
Run Day of the Week analysis to confirm weekly cyclicality. What does it look like? When does the highest volume of activity occur? Is it a consistent pattern? What impact do holidays and weekends have? Missing a solid weekly cyclicality pattern is a red flag for data quality (in B2C).
Check total views and app downloads against new signups. The number of Views should be higher, but surprisingly, it rarely is. The onboarding success rate (Welcome page to Completed Signup) should reflect the Install to Signup drop.
Many more checks must be done across new traffic, premium, security, retention, finance, and monetization.
Managing context and nuance
Companies heavily invest in product analytics tooling. They expect these tools to provide enough support for stakeholders to self-serve through reporting dashboards and data monitoring. And support experimentation. And hopefully, some predictions. And recommendations.
Today's most popular tooling for product analytics is event-based (remember, even Google sunsetted their 15-year-old analytics to switch from sessions to events). However, events come with an ocean of context that has to be recorded, documented, and simply understood:
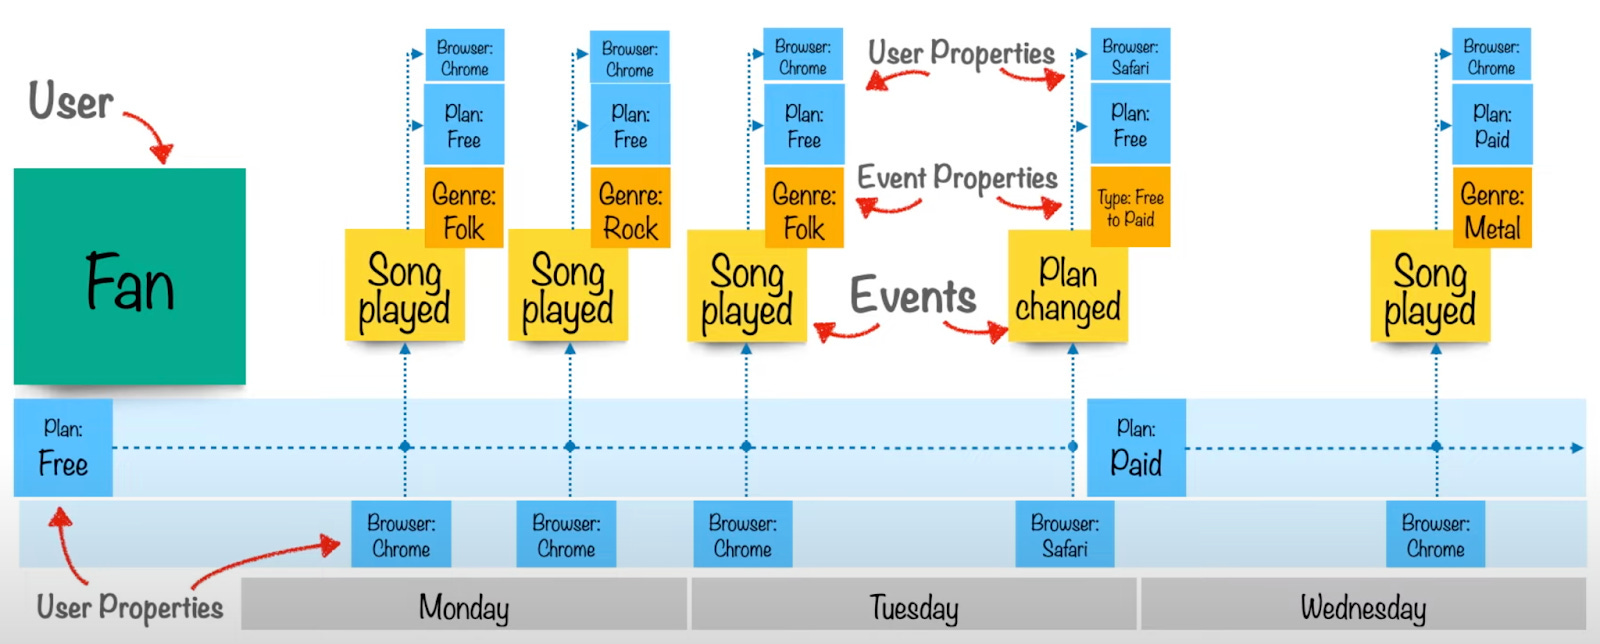
Your success as a product analyst will also depend on your ability to create and maintain this context and the nuance it comes with. You have to understand how your product is built and how it generates the data, which analytics are recorded for every app screen, banner, card, upsell, notification, etc. You need to know common app layouts and user flows and understand the difference between funnel analytics vs. loops vs. trees.
I used to joke that as data analysts, we sell our souls to the Data and Platform engineering teams. Any change they purposely or accidentally make can get us either fired or promoted. Well, for product analytics, your best friend should be a Mobile Software Engineer. Developers can design event streams and analytics in different ways. They can configure the system to capture every piece of data movement and send this tracking payload as a massive unstructured bulk (if this is the case, it doesn’t matter what analytics tool you use, as you won’t be able to make sense of your events anyway). Or they can set the logic for it and aggregate it in a particular way, making it easy for analytics tools to ingest and read the data. Know your friends, send them cookies.
As you can see, knowing SQL and Python and having the ability to extract data insights have little to do with succeeding in product analytics. And yet, surprisingly, no one talks about what it takes and what it needs to be a successful product analyst.
To deliver and bring value, you have to learn:
How to set baselines while not having trusted data.
How to make recommendations when data doesn’t tell a cohesive story and nothing adds up.
How to support experimentation when you don’t have confidence in the test setup.
For these exact reasons, product analytics is the most exciting and fascinating discipline. It’s the most impactful, and the demand for it is accelerating. If you are trying to decide which domain in analytics to choose, I hope this publication has helped you understand it better.
Thanks for reading, everyone. Until next Wednesday!
Great post! Being a BI Analyst for several years makes me more interested. Do you mind recommending the best online courses in your opinion, even if they don't cover all the topics? Thanks!
There are no insights to user behaviour here and how to go about it. This seemed like a very high-level post
Do we have another post where you have written down something similar?